
Gartley Harmonic Pattern
The Gartley pattern is one of the harmonic patterns in technical analysis used to identify potential reversal points in financial markets. It is considered one of the most popular patterns in technical analysis.
It closely resembles the Bat pattern, which we discussed in the previous lesson.
This pattern frequently appears on price charts, and once you learn how to identify it, you can find numerous trading opportunities in the market.
Structure of the Gartley Harmonic Pattern
The Gartley pattern consists of five key points (X, A, B, C, D), forming four main waves that create the structure of the pattern. When the pattern completes at point D, this point represents the Potential Reversal Zone (PRZ).
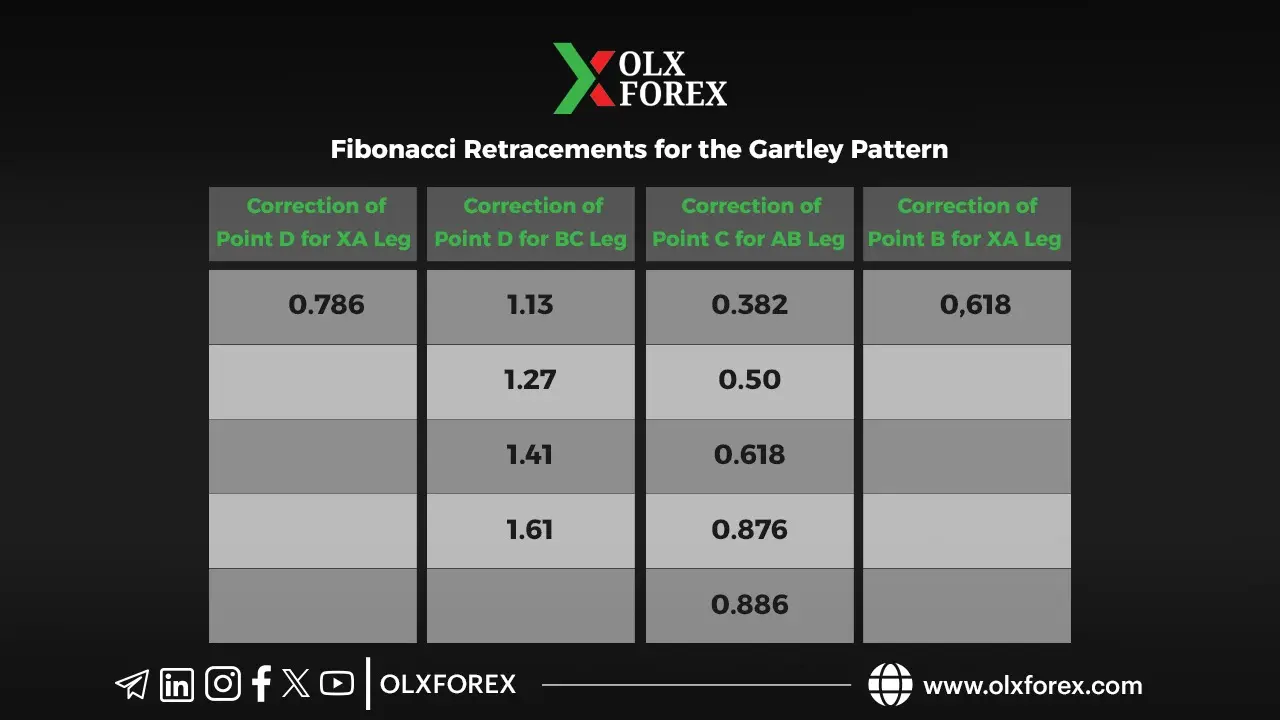
Fibonacci Ratios in the Gartley Pattern
The pattern’s points are determined based on specific Fibonacci ratios:
• XA Leg: The initial price movement, which forms the basis of the pattern.
• Point B: A retracement of the XA leg, typically at 61.8%.
• Point C: A retracement of the AB leg, ranging between 38.2% and 88.6% of AB.
• Point D: The most critical point in the pattern, marking the Potential Reversal Zone (PRZ).
The Potential Reversal Zone (PRZ) is calculated using two key projections:
1. XA retracement at 78.6%.
2. BC extension between 113% and 161.8%.
Types of the Gartley Pattern
1- Bullish Gartley Pattern
In this pattern, the asset is in a downtrend, and upon completion of the pattern, it indicates a potential price reversal to the upside. Traders look for confirmation signals at point D before entering a buy trade.
• Stop Loss: Placed just below point X by a few pips.
• Take Profit Targets:
1. 38.2% Fibonacci retracement of the CD leg.
2. 61.8% Fibonacci retracement of the CD leg.
3. Point C as the final target.
Live Chart Example
(A live example from a price chart can be added here to illustrate the pattern in action.)


2- Bearish Gartley Pattern
In this pattern, the asset is in an uptrend, and once the pattern is completed, it signals a potential price reversal to the downside. Traders look for confirmation signals at point D before entering a sell trade.
• Stop Loss: Placed just above point X by a few pips.
• Take Profit Targets:
1. 38.2% Fibonacci retracement of the CD leg.
2. 61.8% Fibonacci retracement of the CD leg.
3. Point C as the final target.
Live Chart Example
(A real chart example can be added here to visualize the pattern in action.)


Disadvantages of the Gartley Pattern
One of the main drawbacks of the Gartley pattern is that its stop-loss level is slightly higher than that of the Bat pattern. However, the risk-to-reward ratio remains favorable, usually exceeding 1:1.
Important Note
The Gartley pattern, like all harmonic patterns, is more accurate when confirmed using other technical tools, such as:
• Technical indicators
• Trendlines
• Reversal candlestick patterns
• Support and resistance levels
• Divergence signals
• Supply and demand zones
• Liquidity areas and order blocks
Related Harmonic Patterns
• Lightning Pattern (View here)
• Bat Pattern (View here)
Get the Paid Harmonic Trading Course Click here to access the course


