The Crab Harmonic Pattern: A complete explanation of the trading strategy using the Crab pattern
The Crab Pattern is one of the most popular harmonic patterns in technical analysis, discovered by American trader Scott Carney.
This pattern is distinguished by its ability to identify strong reversal points in the market, making it a favorite among many forex and financial market traders.
What is the Crab Pattern?
The Crab Pattern is a reversal pattern that uses precise Fibonacci ratios to identify potential reversal zones in the market. It often appears at the end of a strong trend.
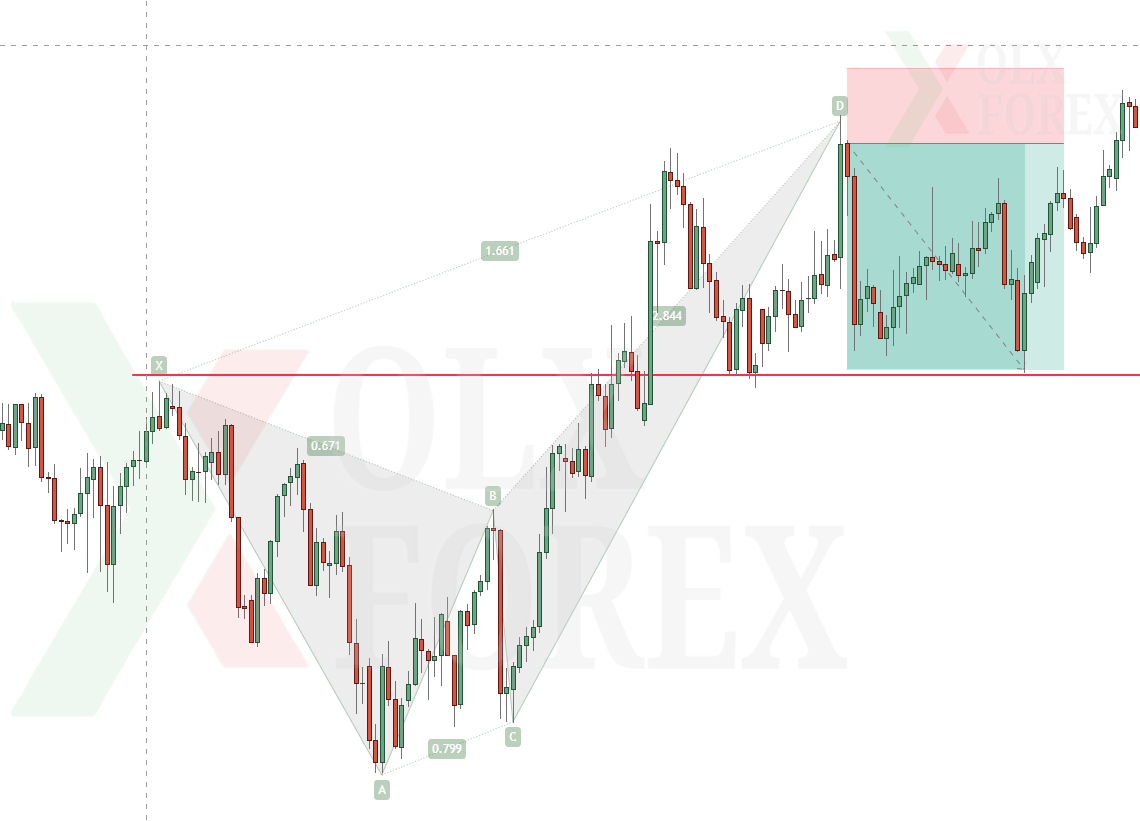
Pattern Structure
The pattern consists of five main points (X, A, B, C, D), which are four main waves that form the pattern's structure. When the pattern is completed, point D becomes the Potential Reversal Zone (BRZ), where traders look for an entry opportunity.
These points are determined based on specific Fibonacci ratios:
- Leg XA: This is the initial price movement and the basis of the pattern.
- Point B: Correction of Leg XA, ranging from 38.2% to 61.8%.
- Point C: Correction of Leg AB, ranging from 38.2% to 88.6% of Leg AB.
- Point D: This is the most important point in the pattern, called the Potential Reversal Zone (PRZ). The potential reversal zone is calculated using two methods:
First: The correction of Leg XA at the 161.8% level.
Second: The retracement of leg BC at levels from 261.8% to 361.8%.
The most important feature of the Crab pattern:
The most prominent feature of this pattern is The Crab pattern exhibits a significant extension of the CD movement. While most other harmonic patterns have smaller extensions, the Crab pattern reaches 161.8% of the XA leg, making the reversal zone very strong.
How to trade using the Crab pattern
Traders typically follow these steps:
- Identify the pattern on the chart.
- Verify the Fibonacci ratios between the legs.
- Wait for the price to reach the PRZ zone.
- Look for a confirmation signal such as:
- Reversal candlesticks
- Divergence
- Overbought or oversold conditions
- A strong support or resistance line or trend line
- Supply and demand zones
- Liquidity zones or order blocks
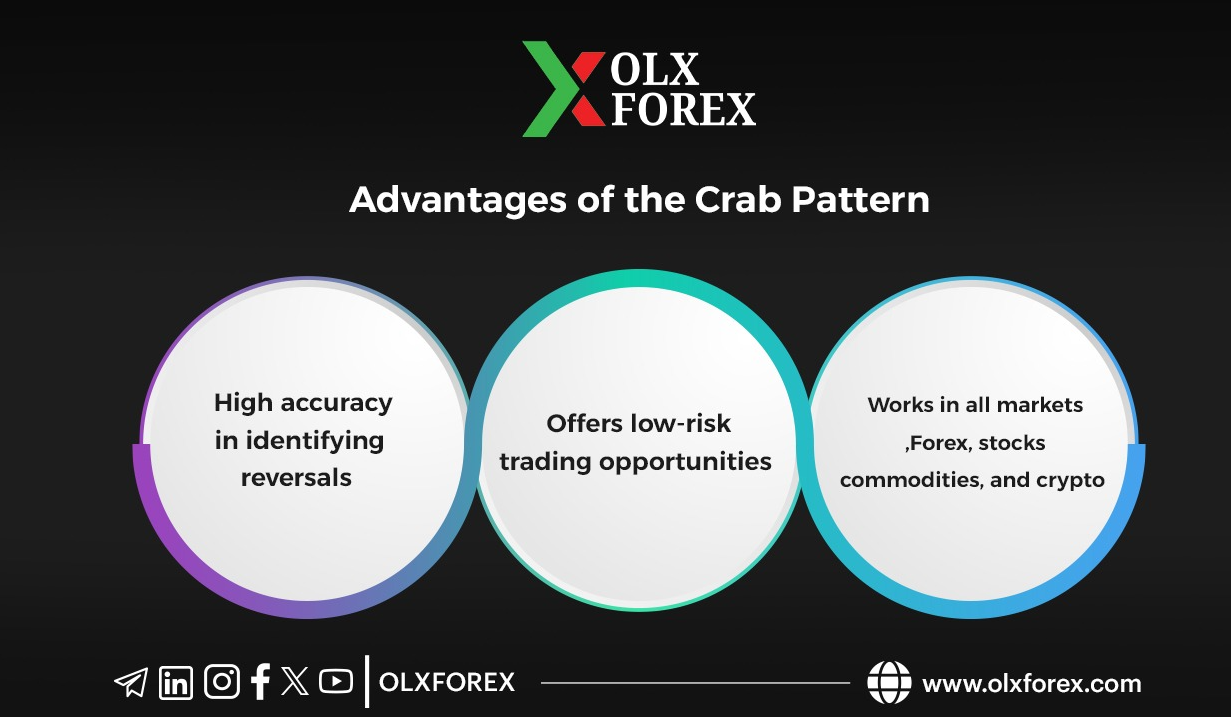
Advantages of the Crab Pattern
- High accuracy in identifying reversals
- Offers low-risk trading opportunities
- Works in all markets: Forex, stocks, commodities, and crypto
Disadvantages of the Crab Pattern
- Requires precise Fibonacci ratio measurement
- May be difficult for beginners to detect
- Must be confirmed by other signals before entering a trade
In conclusion, the Crab pattern is considered one of the most powerful harmonic patterns in technical analysis.
It is distinguished by its ability to identify strong reversal zones in the market, and when used with other analytical tools, it can become a very effective tool in trading strategies.
Here you can access the complete harmonic course, which covers all harmonic patterns, entry methods, targets, stop-losses, and entry techniques and strategies. You will also find many live chart examples here