
The Strongest Technical Indicators and How to Use Them:
We have many powerful technical indicators that offer high probabilities of success.
These include trend indicators, momentum indicators, and others, each serving a specific purpose and requiring a distinct approach for optimal use.
Today, we will briefly discuss some of these indicators.
1. First, let’s focus on momentum indicators, also known as oscillators.
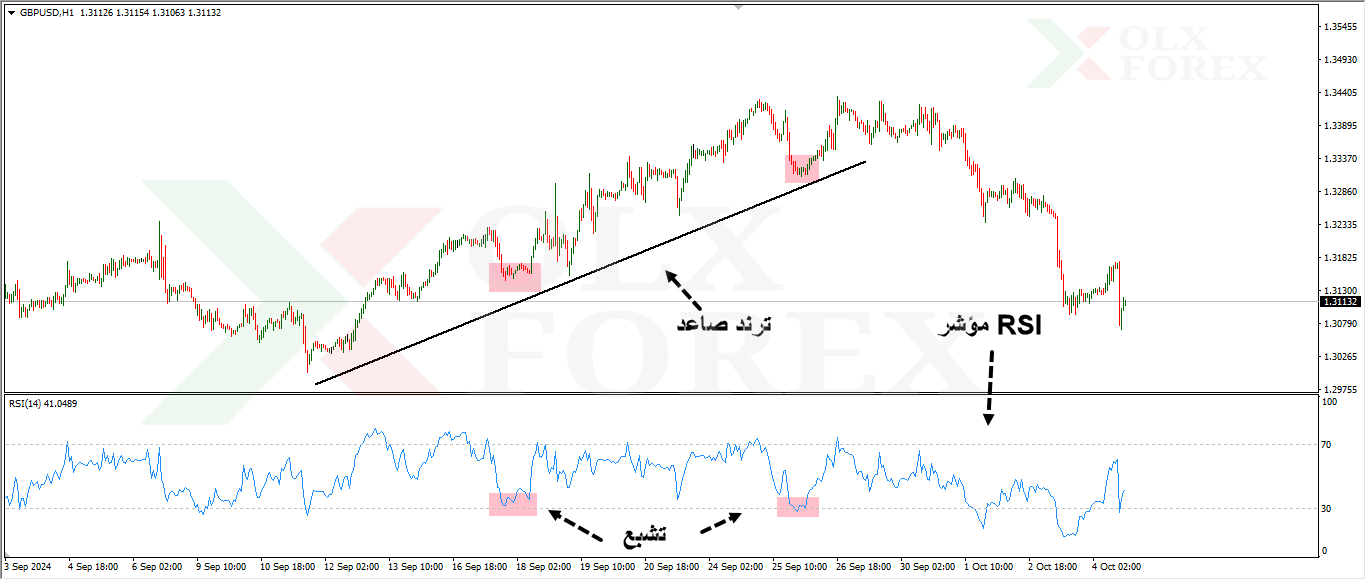
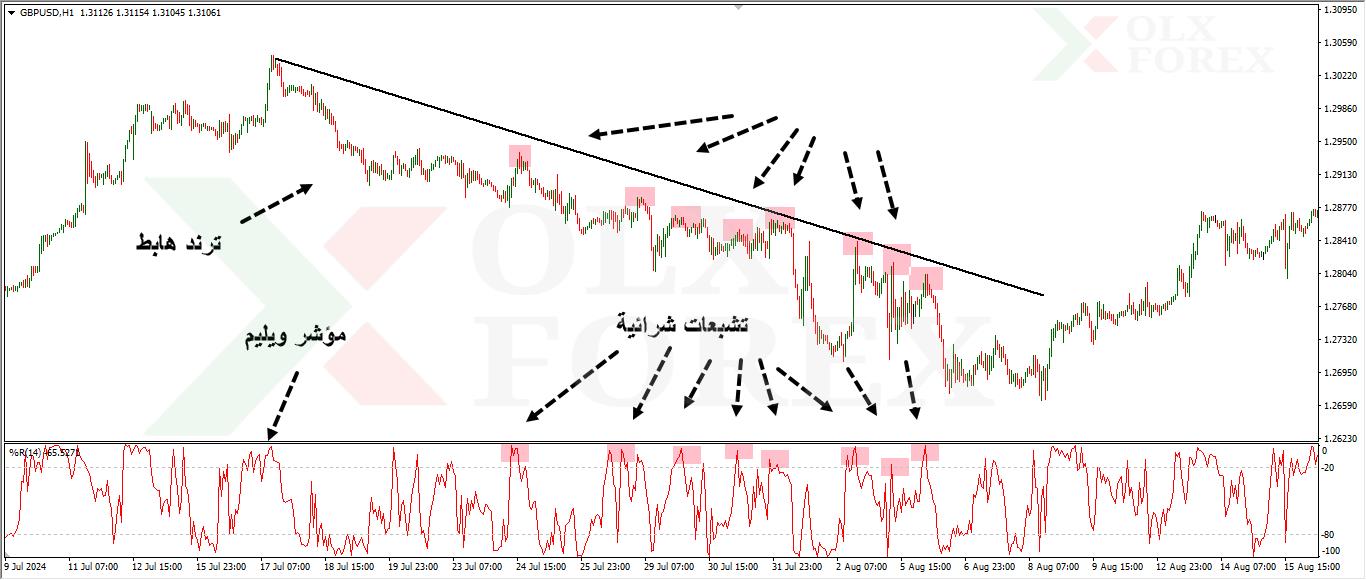
Among the many good oscillators, the most effective are the MACD, RSI, and Williams %R indicators.
These indicators help identify overbought and oversold conditions, with the RSI and Williams %R being particularly useful.
In an upward trend, you should wait for a price pullback and a correction, followed by signs of saturation on these indicators. After that, look for an upward crossover to enter a trade.
This strategy works well in the following situations:
Use it in an upward trend when signals appear in buying areas (support or demand zones).
Additionally, consider signals when prices have not yet reached reversal levels on higher time frames, such as daily or four-hour charts.
By keeping these factors in mind, you can increase the likelihood of receiving strong and successful signals.
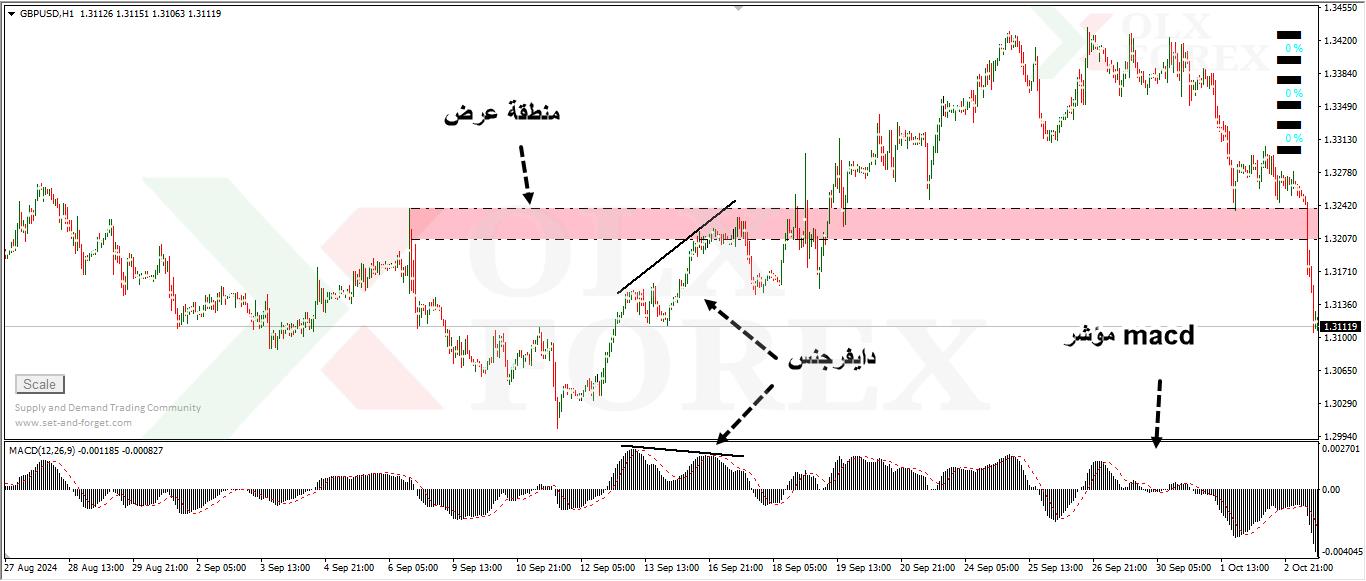
The Second Use: Identifying Divergence
The second application of these indicators is detecting divergence. The strongest indicator for this purpose is the MACD.
It is considered the best for identifying all types of divergence. For a signal to be strong, it should appear in conjunction with buying or selling zones and align with the overall trend.
2. Second: Trend Indicators
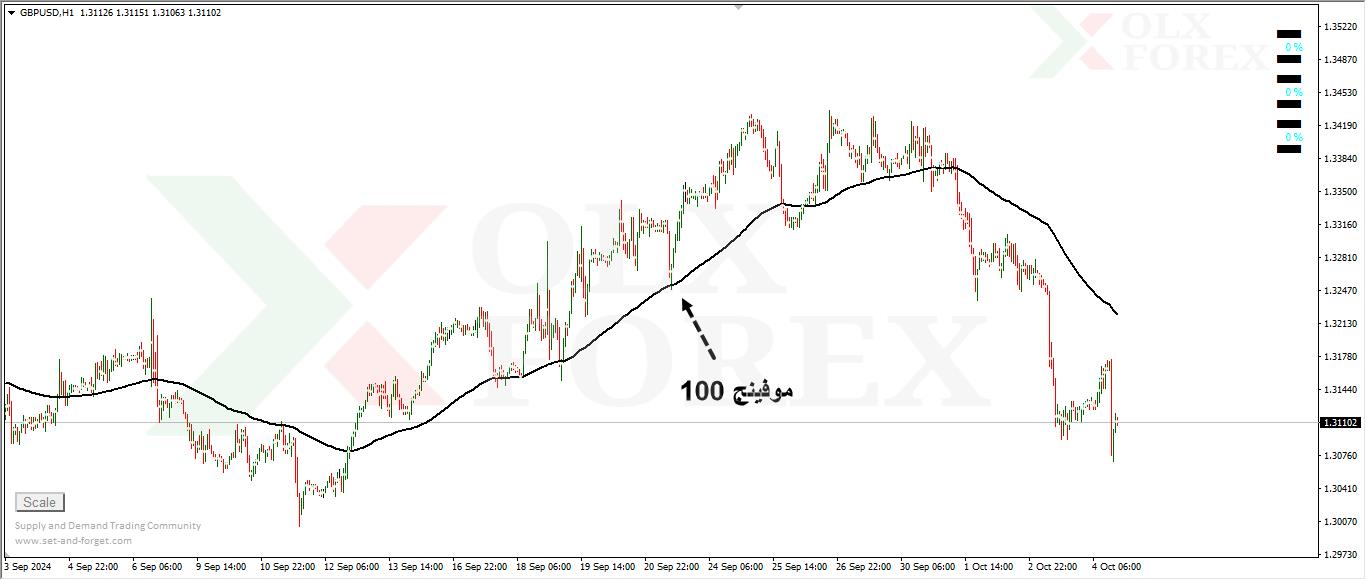
Moving Average (MA):
One of the strongest trend indicators is the Moving Average. You can use various moving averages to determine the trend, each with its specific time frame. Additionally, you can combine multiple moving averages to identify entry points.
We have many successful strategies based on these concepts available in the OlxForex store for you to explore.
Some examples of moving averages:
✅100-period MA for the 4-hour and 1-hour time frames.
✅ 200-period MA for shorter time frames like the 4-hour.
✅ 10 and 20-period MAs for the daily time frame.
These moving averages can effectively identify trends. You can start with a specific moving average to determine the trend on a higher time frame, then switch to lower time frames and look for crossovers with other moving averages, which can signal strong entry points.
However, keep the following points in mind:
The signal should align with the trend direction.
The signal should occur after a bounce from entry zones.
Avoid entering when signals appear near reversal areas on higher time frames.
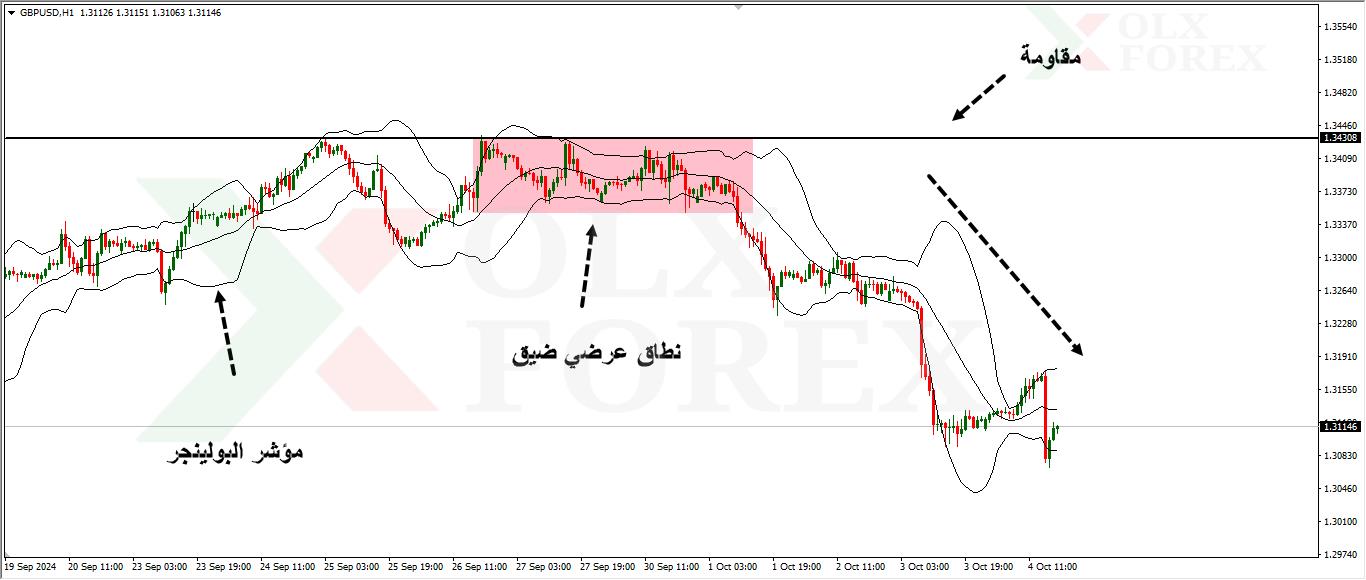
Bollinger Bands:
Bollinger Bands is one of the most popular trend indicators, known for its various strategies and trading methods.
The Bollinger Bands consist of three lines: two lines representing price deviations (upper and lower bands) and a middle line, which is the moving average that acts as a magnet for prices.
For example, in an uptrend, traders often wait for prices to drop to the lower band before entering a buy position, aiming to reach the middle line, which represents the average price. The target may extend to the previous high, which is often close to the upper Bollinger Band.
Another strategy involves looking for a tight squeeze between the three lines, indicating low volatility and the potential for a price breakout.
When using Bollinger Bands in conjunction with trends, it’s best if the entry signals align with key support and resistance levels or supply and demand zones to strengthen the signals.
These are some of the most important and effective indicators that have demonstrated real success in the financial markets.
We may delve deeper into another topic to explain additional indicators, so stay tuned for more updates.
Wishing everyone successful trading!
You can read more important and useful educational articles from here.


