
About the Indicator
The Parabolic SAR indicator is a trend identification indicator.
It is a popular technical indicator used by many traders, both beginners and professionals, to confirm trend movements.
It was developed by G. Wells Wilder, the creator of the Relative Strength Index (RSI).
The indicator is used to identify entry and exit points for trades.
In addition to identifying the trend, it is recommended to combine it with other technical indicators to maximize its effectiveness.
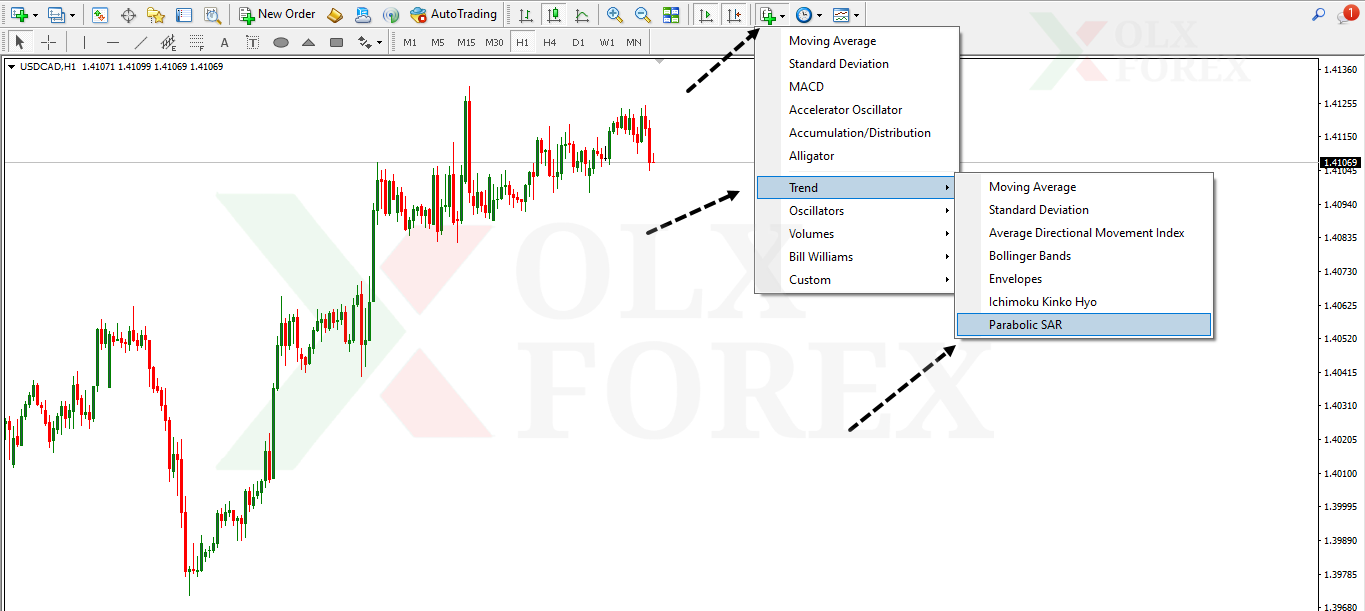
How to Add It to the Chart
First, go to the Indicators list.
Second, go to the Trend list.
Third, select the Parabolic SAR indicator.
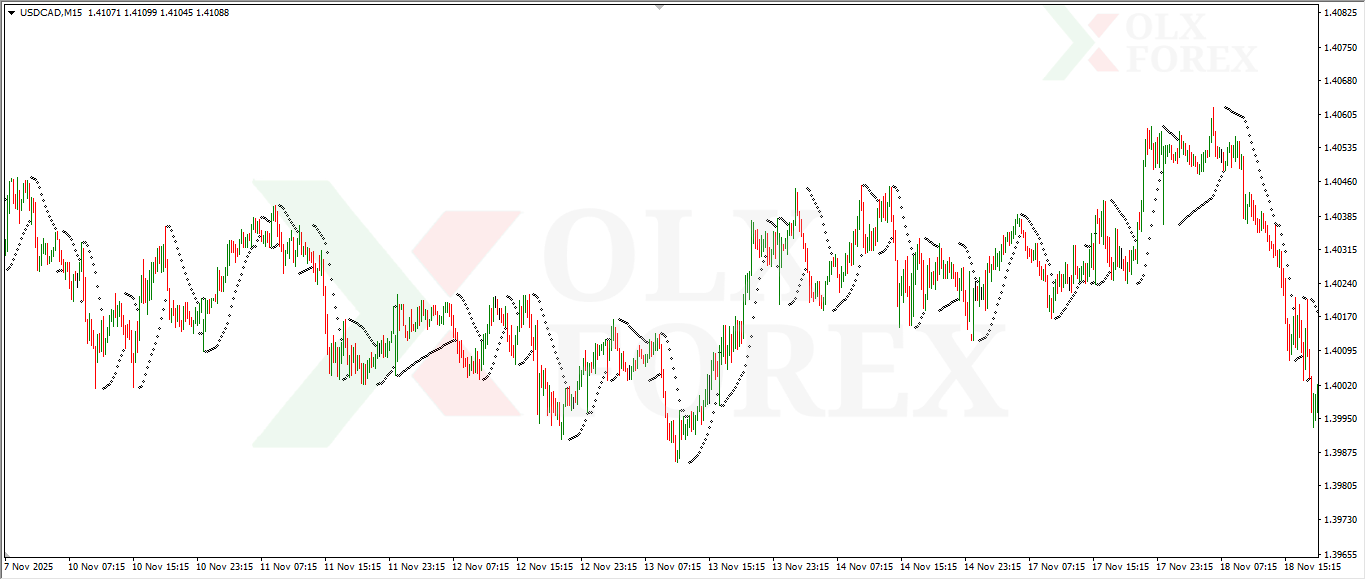
How the Indicator Works
When you add the indicator to the chart you want to trade,
dots will appear below and above the Japanese candlesticks.
Uptrend: In an uptrend, dots will appear below
the Japanese candlesticks, indicating that the price is currently moving upwards.
Downtrend: In a downtrend, higher points will appear on the Japanese candlesticks,
indicating a current downward movement.
Integration with Technical Indicators
It is recommended to use this indicator in conjunction with other technical indicators to obtain
high accuracy in identifying available opportunities.
Oversold indicators, such as the Stochastic Oscillator and Moving Average, are among the best technical indicators to combine with the Parabolic SAR indicator.
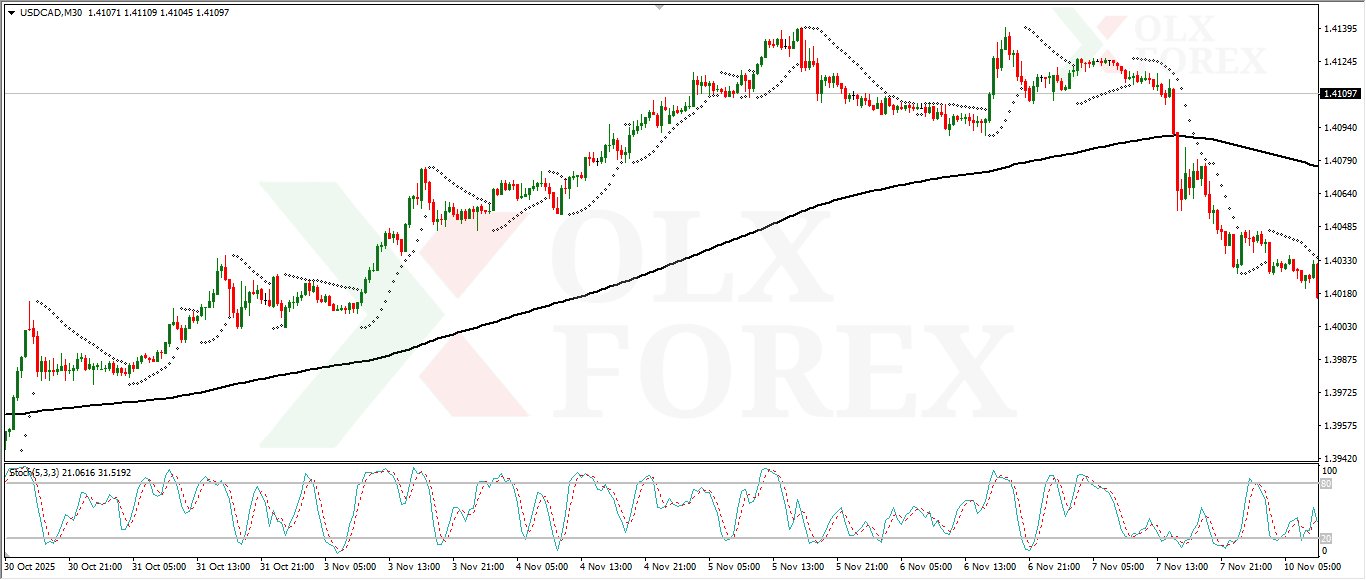
Chart Example:
Uptrend and Buying Opportunities
Here, we observe that the trend was upward, confirmed by the 200-period Moving Average.
Whenever oversold conditions occur on the Stochastic Oscillator, a bullish signal appears on the Parabolic SAR, providing a good buying opportunity.
This also aligns with the upward trend confirmed by the Moving Average.
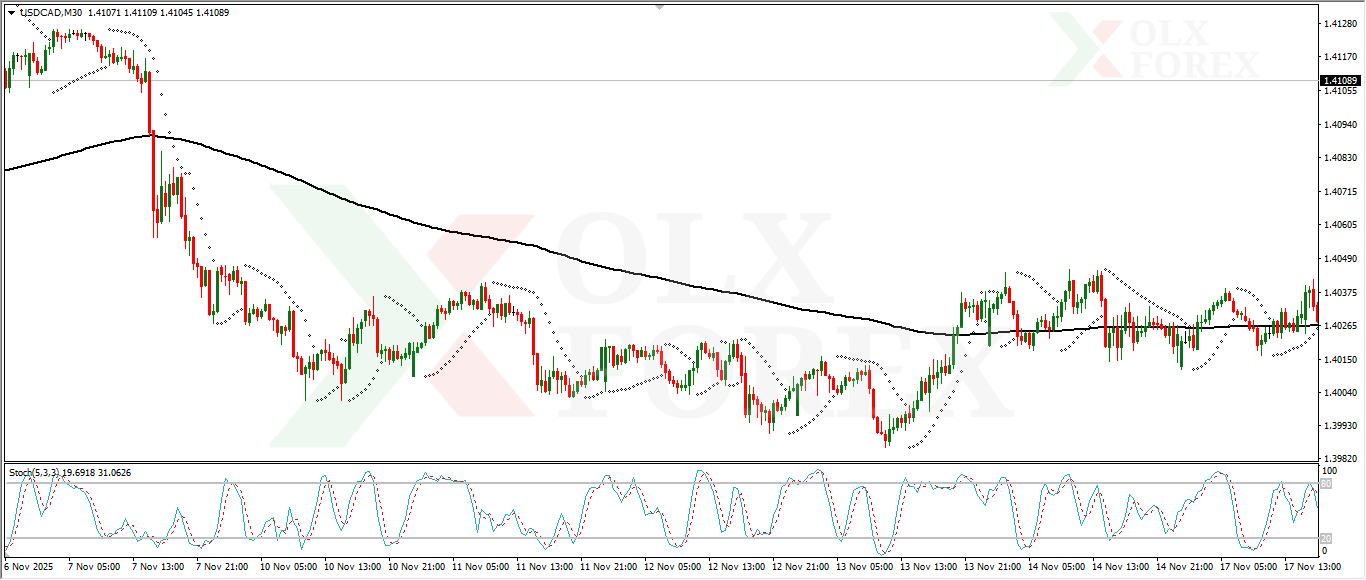
Downward Trend and Selling Opportunities
Here, we observe a downward trend, confirmed by the 200-period moving average.
Whenever overbought conditions occur on the Stochastic oscillator, a signal appears.
The Parabolic SAR indicator confirms the downward trend, providing a good selling opportunity.
This also aligns with the downward trend confirmed by the moving average.
Important Tips
_ The indicator is considered good, but it should be used
in conjunction with other technical indicators.
_ When trading, be cautious of support and resistance levels and avoid trading against them.
_ Exercise caution during news releases to avoid sudden price movements and triggering stop-loss orders.


