The false breakout has different forms and many trading methods, as well as many causes, but one of the most important is that the manufacturer enters the market forcefully to take prices from the best area for buying or selling in order to expel small investors (not all the time). Regardless of the reasons for its occurrence, what concerns us is how to discover it and how to determine it. If it is a real break or a false break, and how and when to enter and exit.
The false fraction has different forms, as we said, but we will now try to consider the most important of them:
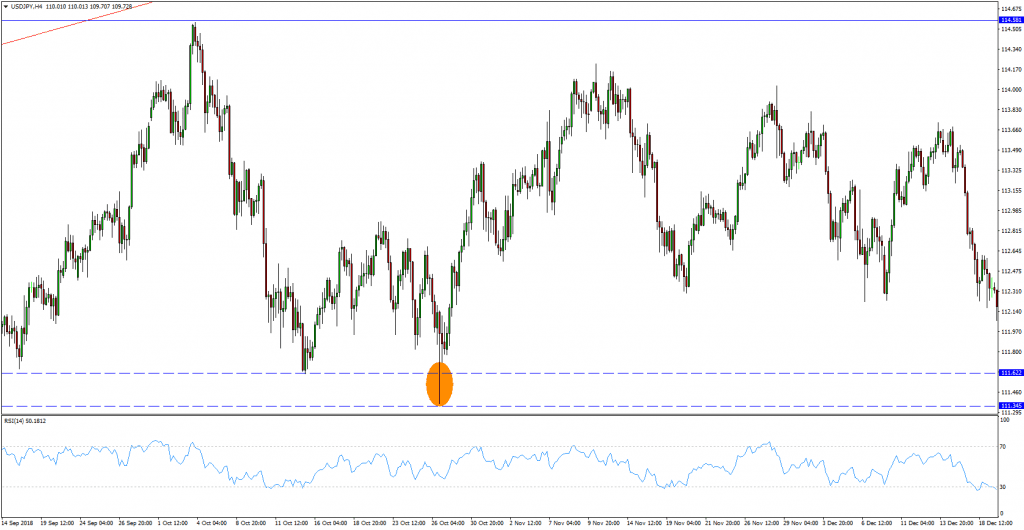
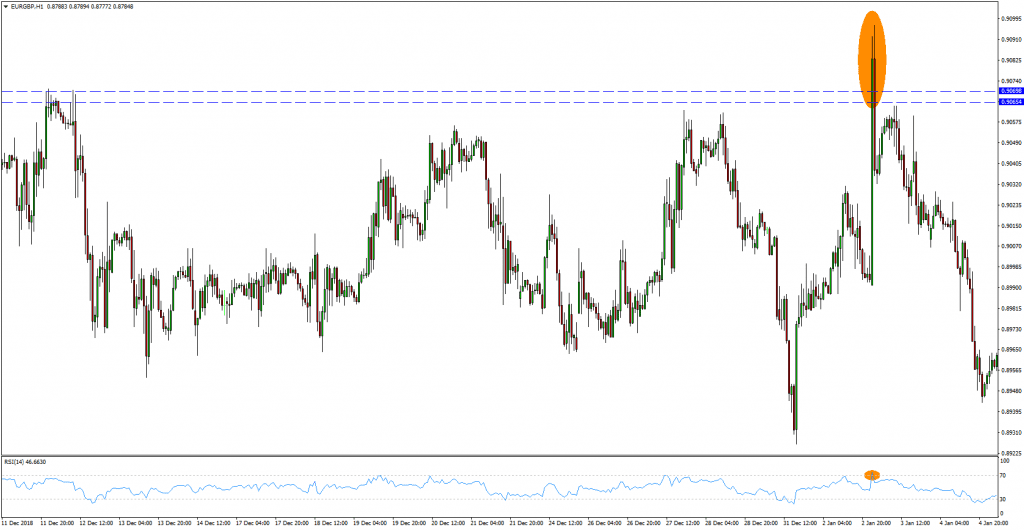
1- Breaking the candle tails
As we see on the USD/JPY pair on the four-hour frame, there is support that was broken with a tail, but it was a false break and the price rose strongly after that.
The first rule: never rely on tails and wait for the candles to close to judge the candle finally.
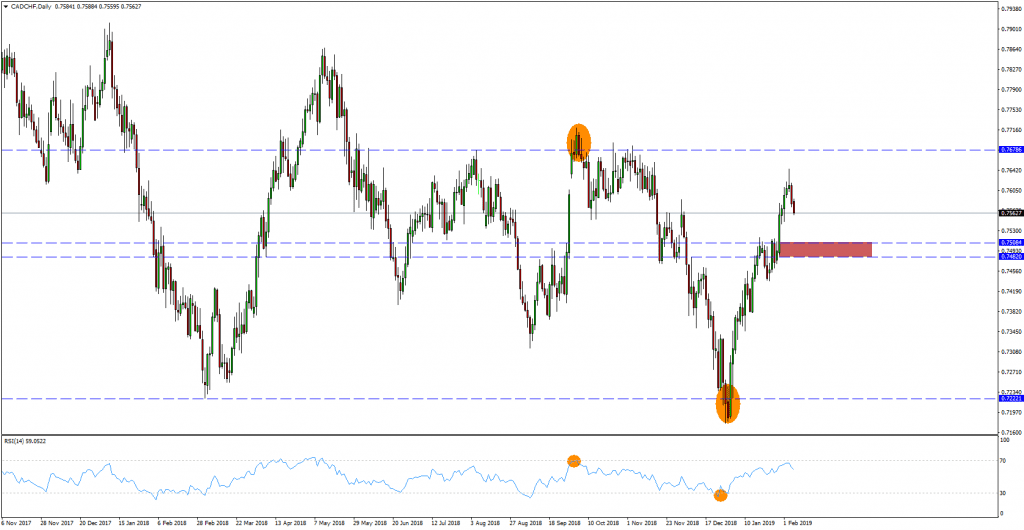
2- A break in the candle body
This type is the most dangerous and confusing among traders, so how do we pay attention to it and avoid falling into its trap? Simply wait for one of 2 confirmations to be sure that it is a real breakout:
1 - Close two candles below the support level or above the resistance level
2 - The emergence of explicit price behavior, such as swallowing candles, for example
3- Waiting to repeat the test after the fracture
These three signs will make you able to distinguish well. These are examples of false fractures in a candle, but the conditions are not met.
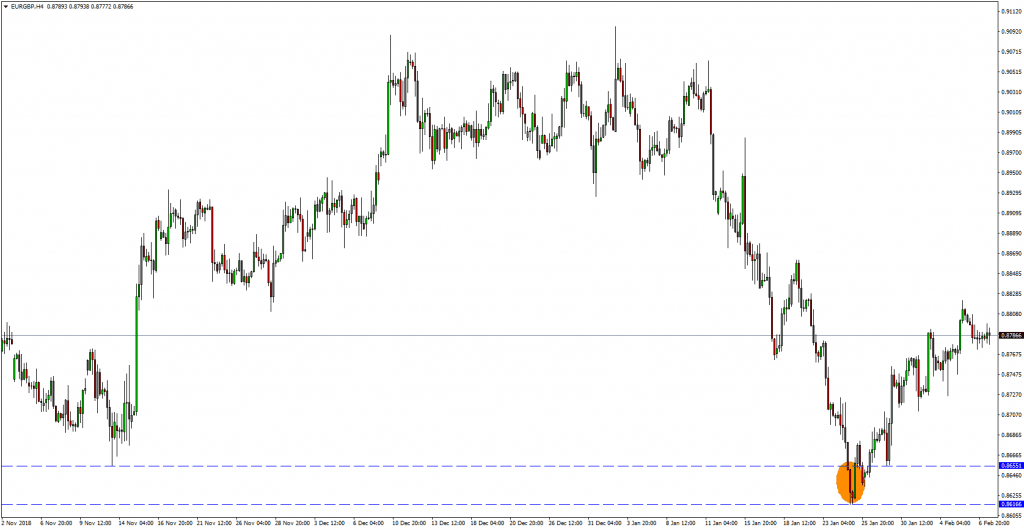
3 - False fracture (due to a stronger level)
Meaning, it is possible for the price to break a support/resistance level to meet a stronger level that will return the price up/down.
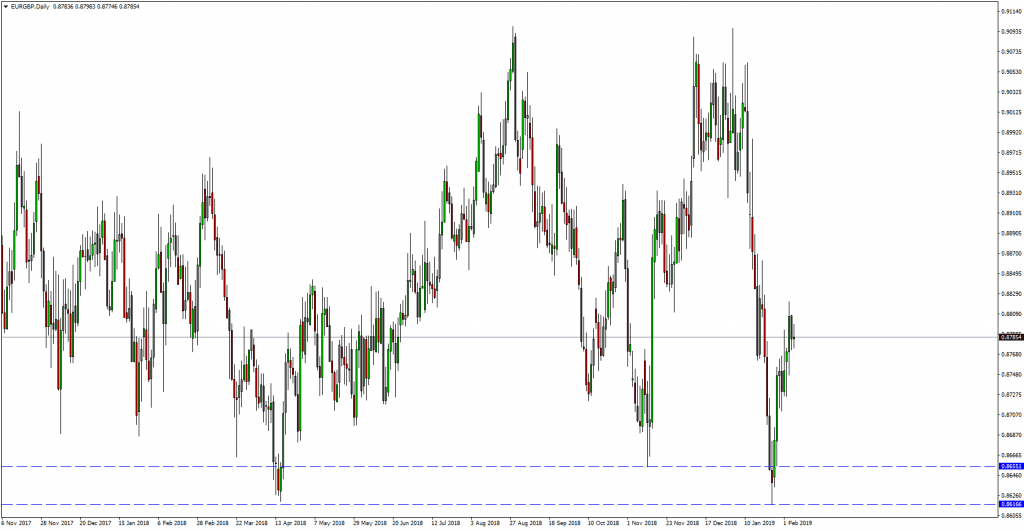
Let's take an example of the EUR/USD four-hour and daily frames
The price broke a four-hour support level as a false break and rebounded from a strong level below it, as a result of this level being strong price support on the daily frame, so strong levels must be drawn