
Which is Better: Technical Analysis or Fundamental Analysis?
When entering the world of financial markets, a novice investor often faces a pivotal question: How do I make my investment decisions? Should I rely on economic data or chart patterns? This is the crux of the debate between two main schools of thought: fundamental analysis and technical analysis.
Each has its own philosophy, tools, and followers.
We will attempt to simplify these two approaches, highlighting their advantages and disadvantages, and explaining how you can combine them to make smarter decisions.
First: Fundamental Analysis: It's about finding true value
The idea is simple: fundamental analysis is like monitoring the health of one country's economy compared to another. You buy the currency of a strong economy and sell the currency of a weaker one.
What does it study? (Its main tools):
A country doesn't have financial statements, but it does have economic indicators and monetary policies that serve as financial reports.
What are the economic indicators?
- Interest rates: This is the most important factor. When a central bank (such as the US Federal Reserve or the European Central Bank) raises interest rates, investments in that currency become more attractive (due to the higher return), which increases demand and raises its value.
- Inflation: This is measured by the Consumer Price Index (CPI). High inflation often prompts the central bank to raise interest rates, while low inflation leads the central bank to lower interest rates.
- Gross Domestic Product (GDP): This measures the health and growth of the economy. Strong growth supports a strong currency.
- Employment Index (such as the US NFP): An economy that provides jobs is a strong economy, which strengthens its currency.
- Geopolitical events and news: Elections, trade agreements, wars, or any news that causes political instability can significantly affect a country's currency. Natural disasters such as earthquakes, volcanic eruptions, and tsunamis also affect the currency of the country where the disaster occurred.
- Market sentiment and risk: Are investors risk-on, buying currencies like the AUD and NZD, or risk-off, such as the Japanese yen (JPY) and the Swiss franc (CHF)?
The goal of fundamental analysis:
To determine the long-term trend of a currency pair based on the strength or weakness of the underlying economies.
Advantages of fundamental analysis:
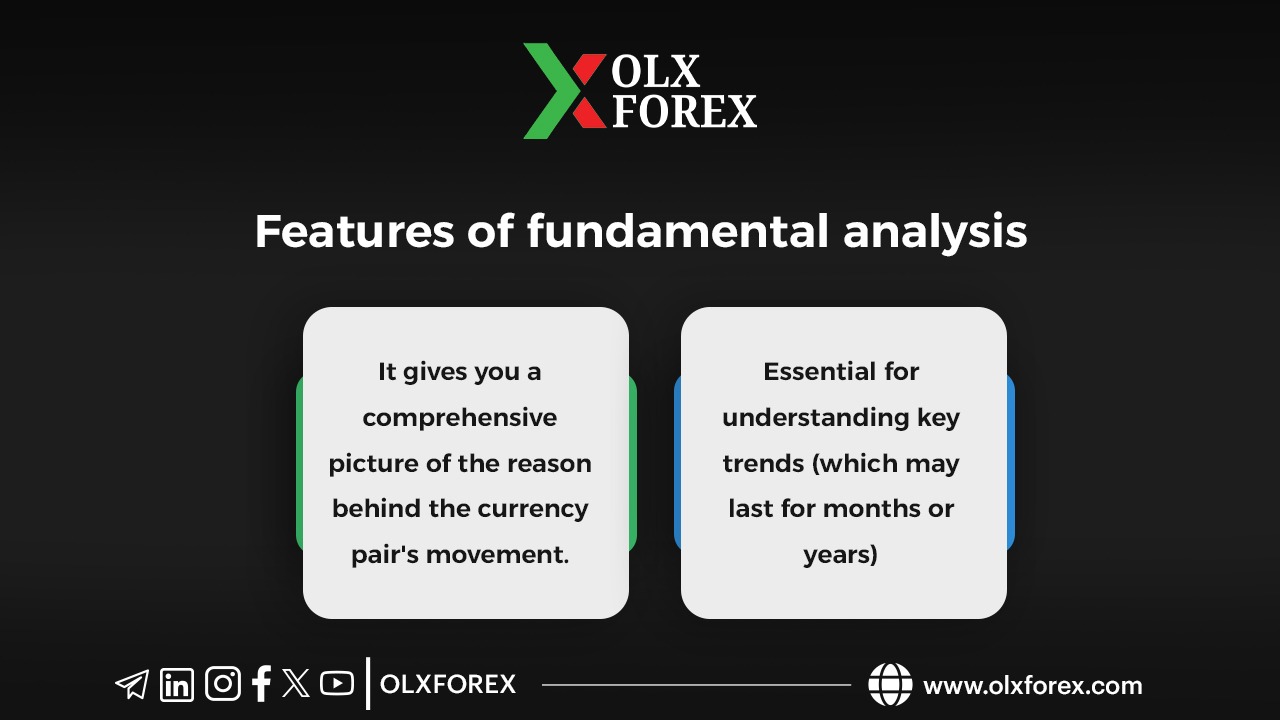
- It provides a comprehensive picture of the reasons behind the currency pair's movement.
- It is essential for understanding major trends (which may last for months or years).
Disadvantages of fundamental analysis:
- It doesn't tell you the precise timing for entering a trade.
- Conflicting data can confuse the analyst (e.g., good employment figures but low inflation).
- Reactions to news can be irrational and volatile in the short term. Sometimes the market prices in the news before its release, and we see a result on the chart that contradicts the news.
This depends on the trader's experience in interpreting such news through long-term market monitoring of this type of event.
Secondly: Technical Analysis in Forex: The Language of Charts
Technical analysis is the process of analyzing financial markets using historical data and charts to understand future price trends. It's based on the idea that "history repeats itself." You study the past price movements of a currency pair to predict its future movements, regardless of the underlying cause.
Simply put, a technical analyst is like a weather forecaster for the markets. They don't focus on "why" it rained, but rather on cloud and wind patterns to predict tomorrow's weather.
Technical analysis involves using technical indicators and chart patterns to identify key price and time points.
What does it study? (Its main tools):
- Charts and Trends: Determining whether the pair is in an uptrend, downtrend, or sideways trend.
- Support and Resistance Levels: Price points where the price frequently bounces or breaks through. These are crucial in the forex market due to its high liquidity.
- Japanese Candlestick Patterns: Used to predict trend reversals or continuations over short timeframes.
Technical Indicators:
Among the most important technical indicators are:
- Moving Averages: Used to identify trends and dynamic support/resistance levels.
- RSI or Stochastic Oscillator: Used to identify overbought or oversold conditions.
- MACD Indicator: Used to measure trend momentum and identify divergences.
Advantages of Technical Analysis:
- Ideal for short-term day trading and swing trading.
- Applicable to any currency pair and any timeframe.
- Helps in precise risk management by setting stop-loss and take-profit levels.
Disadvantages of Technical Analysis:
- Ignores the fundamental reasons for price movements, which can expose you to surprises (such as an unexpected central bank decision).
- Indicators can give false signals, especially in volatile markets.
Ultimately, it's best to combine both approaches and not use one analysis while neglecting the other, as they complement each other.
Fundamental Analysis for Determining the Trend (The "Why"):
Ask yourself, is the US economy stronger than the European economy? This will give you a directional bias in the EUR/USD pair. Am I a buyer or a seller in the trades?
Technical Analysis for Timing the Trade (The "When"):
Ask yourself, based on my sell bias for EUR/USD, what is the best time to enter a sell trade? Has the price reached a strong resistance or supply level? Have the indicators shown a sell signal?
In this way, you benefit from the full power of fundamental analysis in understanding the big picture and technical analysis in executing trades.


