

Why does a high success rate not necessarily mean that a trading strategy is profitable?
Introduction
A high success rate for a trading strategy does not automatically imply sustainable profitability. A trader might win the majority of their trades, yet still lose money due to a single large loss or the cumulative impact of trading costs. Therefore, evaluating a strategy requires looking at the magnitude of profits and losses, as well as the associated risks—not just the number of winning trades.
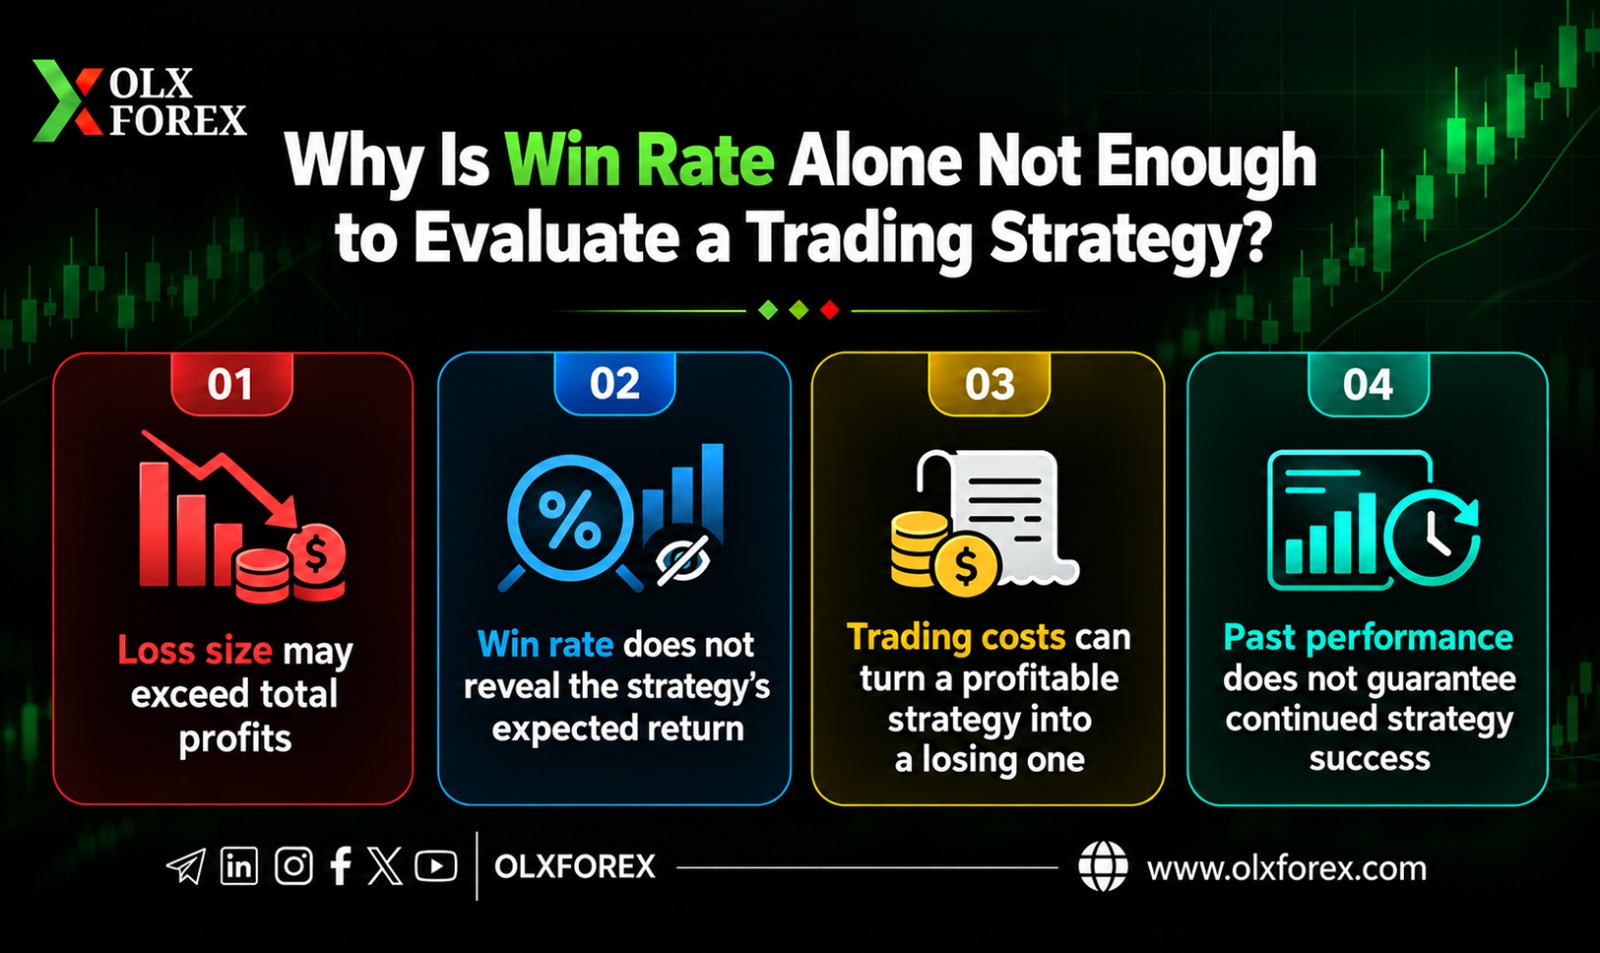
1. The magnitude of losses can exceed total profits
One common mistake is relying on the percentage of winning trades without comparing the average profit to the average loss. A strategy might generate small gains across most trades, while a single losing trade wipes out the profits accumulated from several previous wins.
For example, if a trader earns $10 on each winning trade but loses $50 on a single losing trade, five winning trades would not be enough to offset that one loss—even though the success rate might appear high.
2. The success rate does not reveal a strategy’s expected return
The "expected return" is one of the most critical metrics for assessing the quality of a strategy, as it integrates the probability of winning with the average size of both gains and losses. It can be calculated using the following equation:
Expected Return = (Profit Percentage × Average Profit) − (Loss Percentage × Average Loss)
For instance, if the success rate is 70%, the average profit is $10, and the average loss is $25, the expected return would be:
- Expected gains: 70% × $10 = $7.
- Expected losses: 30% × $25 = $7.50.
- Expected return = a loss of $0.50 per trade, before accounting for trading costs.
This means that while a strategy might yield seven winning trades out of every ten, it could still be unprofitable in the long run if these averages persist.
3. Trading costs can turn a profitable strategy into a losing one
Even if a strategy’s expected return is positive before accounting for costs, factors such as bid-ask spreads, commissions, and slippage can reduce profits or eliminate them entirely—especially in strategies that rely on frequent, short-term trades.
For example, if the expected average profit per trade is $1.00, but the actual trading costs amount to $1.20, the net result is a loss of $0.20 per trade—even though the strategy appeared profitable before these costs were factored in.
Therefore, trading results must be evaluated after deducting all actual costs, while keeping in mind that these costs vary depending on the currency pair, market conditions, and account type.
4. Past performance does not guarantee the continued success of a strategy.
A trading strategy may yield excellent results during a specific period due to favorable market conditions, yet lose its effectiveness when market volatility, trends, or liquidity shift.
Furthermore, a strategy might appear successful when tested against historical data, only to fail in live trading because its settings were overly tailored to fit that past data—a phenomenon known as "overfitting."
To mitigate this risk, a strategy should be tested on data not used during its development, evaluated across various market conditions, and monitored in live trading. It is essential to focus on metrics such as the maximum drawdown (the peak-to-trough decline in capital) and the stability of performance, rather than relying solely on the success rate.
Summary
The success rate of a Forex strategy is not a sufficient metric for judging its profitability. More critical factors include the relationship between average gains and losses, the expected return per trade, execution costs, and the strategy's ability to remain effective under diverse market conditions. A sound strategy is not necessarily one that wins the highest number of trades; rather, it is one that generates a positive expected return—net of costs—while maintaining manageable levels of risk.


