

Gold Prices and Year-End Closings in 2026
Gold prices experienced sharp fluctuations throughout 2026, after hitting record highs of over $5,500 per ounce in January, before undergoing a sharp correction that briefly pushed prices below the $4,000 level in June, amid rapidly changing global economic and geopolitical conditions.
After three years of consecutive gains, the yellow metal faced increasing pressure throughout 2026, with factors influencing its movements ranging from escalating geopolitical tensions, shifting expectations for U.S. interest rates, and fluctuations in the dollar and Treasury yields, to continued gold purchases by central banks.
As the year draws to a close, investors are increasingly wondering about the expected direction of gold prices and whether the precious metal will be able to resume its upward trajectory or if selling pressure will continue to limit its gains.
What are the key factors that will determine the price of gold at the close of 2026? And what are the forecasts of investment banks and global financial institutions regarding per-ounce levels for the remainder of the year?
In this report, we review the key events that influenced gold prices in 2026, the most notable forecasts from global institutions, and the possible scenarios for the yellow metal’s movement through the end of the year.
1- Gold’s Historic Surge to Over $5,500 in January
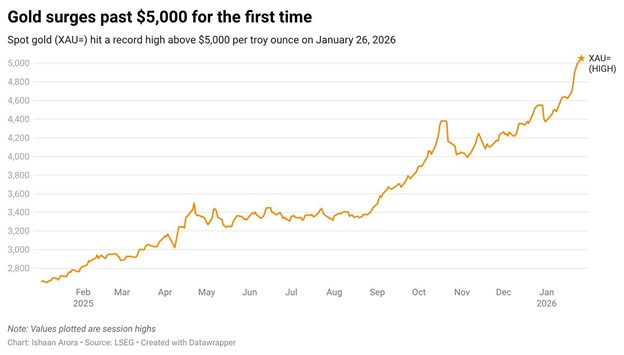
The year began with a strong rally that pushed gold to record highs exceeding $5,500 per ounce in January, driven by escalating geopolitical risks and increased investment demand for the precious metal.
A report by the World Gold Council showed that gold set 12 new record highs in January, accompanied by heightened volatility and increased options trading activity.
Buying momentum helped accelerate the rally, but it also made the market more vulnerable to profit-taking and price corrections later on.
The rally pushed prices to historic highs, but it also increased investors’ sensitivity to any changes in interest rate expectations, liquidity, or geopolitical risks.
2. The U.S.-Israel-Iran Conflict and Energy Market

Turmoil War and tensions related to Iran were among the most prominent factors that increased market volatility during the year, not only because of the demand for gold as a safe haven, but also because of their impact on oil prices, inflation, and monetary policy expectations.
The significance of this factor lies in two opposing effects:
• A factor supporting gold: Rising geopolitical risks prompt some investors to increase their holdings of safe-haven assets.
• A factor weighing on gold: Rising oil prices may increase inflationary pressures and delay interest rate cuts or reinforce expectations of rate hikes, which could support the dollar and bond yields and limit gold’s gains.
The World Gold Council noted that shifts in geopolitical risks and investor sentiment were key factors behind gold’s volatility during the first half of 2026.
3. Shifting Expectations for U.S. Interest Rates and the Dollar
The Federal Reserve was one of the most important factors determining the direction of gold in 2026, particularly as markets shifted from expectations of monetary easing to bets on a more hawkish stance.
As expectations for U.S. interest rate hikes rose, the dollar and bond yields climbed, reducing the appeal of non-yielding gold.
This effect was clearly evident in June, when a Reuters report noted that gold had fallen from its all-time high of $5,595 in January to levels near $4,000, amid rising rate expectations and a strong dollar.
This factor resurfaced in October, as stronger-than-expected U.S. inflation data caused gold to fall 1.8% on October 14 to $4,083.94 per ounce, before recovering the following day as the dollar and yields retreated.
Inflation did not always support gold; rather, it put pressure on the metal when it led to higher interest rate expectations, while gold benefited from a weaker dollar and lower yields when those expectations subsided.
4. Central Bank Purchases and Investment Demand
Despite the pressures on gold, central bank purchases and the diversification of reserves away from the dollar remained important structural factors in the market.
Data from the World Gold Council showed that global demand for gold during the first quarter reached 1,231 metric tons, with a record value of $193 billion, while purchases of gold bars and coins totaled 474 metric tons, a 42% year-over-year increase.
In September, reported central bank purchases totaled approximately 63 metric tons, according to preliminary data reported by the Financial Times on October 15—the highest monthly level since November 2024.
Reports from financial institutions (such as Goldman Sachs) also showed that the People’s Bank of China’s actual purchases were 75% higher than what was officially announced during certain periods.
The significance of official and investment demand lies in the fact that it can provide support for gold even when high interest rates lead to short-term pressures.
Gold in the Near Term
In the near term, U.S. inflation data released this week came in higher than expected, but after a slight decline in gold prices, the metal resumed its upward trend, as the reason for this move is that markets do not react to inflation alone, but rather to its expected impact on the dollar, bond yields, and Fed decisions, and then reassess these factors during trading.
The reasons for gold’s rebound and rise despite high inflation are:
1- A true hedge against inflation (Inflation Hedge)
Although high inflation is prompting the Fed to consider tightening monetary policy (which is negative for gold in the short term), at the same time, it serves as a reminder to markets that the purchasing power of fiat currencies is eroding; this revitalizes demand for gold as the historical safe haven for preserving value over the medium and long term.
2- The Dollar Retreats After Rising on the Back of the Data
Data released on October 14 showed that the U.S. Consumer Price Index rose 3.7% year-over-year in September, up from 3.4% in August and higher than the 3.6% forecast.
This initially led to a rise in the dollar and put pressure on gold. However, on Thursday, the dollar index fell by about 0.5%, according to Reuters, which reduced the cost of buying gold for investors using other currencies and helped the metal recover.
3. Decline in U.S. Treasury Yields
The yield on the 10-year U.S. Treasury note fell to its lowest level in about three weeks during Thursday’s trading, a development that supported gold’s recovery following the previous sell-off.
The relationship here is important: when yields fall, the opportunity cost of holding non-interest-bearing gold declines; therefore, gold can rise even as inflation concerns persist, if real yields fall or the dollar weakens.
4. Officials’ Statements and the Easing of Short-Term Panic
Despite the disappointing inflation data, comments from some Fed members (such as San Francisco Fed President Mary Daly) indicated that there is no urgent need to hastily raise interest rates at the upcoming October meeting, which eased fears of immediate excessive tightening and restored stability to the markets.
5- Technical Buying
Wednesday’s sharp decline (below the $4,100 level) prompted many investors and institutions to view the drop as a buying opportunity, creating strong buying momentum that helped the metal recover quickly.
Some reports also indicated that the $4,000-per-ounce level represents an important support zone, with investment flows into gold funds and central bank demand for the metal continuing.
6. Volatility in Energy Markets and Geopolitical Factors
The temporary pullback in the rally of oil prices, along with movements in bond yields and currency-related factors, helped ease selling pressure on non-yielding assets such as gold and silver.
Here is a comprehensive summary of the most notable forecasts from foreign institutions for the closing price of gold at the end of 2026:
- Goldman Sachs:
The bank raised its official forecast for the closing price of gold in December 2026 to $4,900 per ounce, driven by continued strong buying by central banks worldwide and increased cash flows into Western exchange-traded funds (ETFs).
- HSBC Group:
This is one of the most optimistic forecasts, suggesting that gold will reach the $5,000-per-ounce mark by the end of 2026.
- Commerzbank:
The bank revised its outlook for the year to align with the $5,000-per-ounce level, citing continued inflationary pressures and growing demand for safe-haven assets.
- Morgan Stanley:
It sets its estimate at $4,400 per ounce by the end of the period, pointing to sustained but cautious growth compared to previous price peaks.
- Bank of America:
The bank expects an average of around $4,000 per ounce during the fourth quarter of 2026, with the possibility of the price falling below this level over the next three months.
A recent report also noted the possibility of testing the $3,750 level in a bearish scenario.
The $4,000 level is an expected average for the quarter, not necessarily the closing price on December 31.
- Deutsche Bank:
It takes a relatively more subdued view, expecting average prices to hover around $4,000 per ounce throughout 2026.
Key Factors Driving These International Forecasts
International reports indicate that the divergence in forecasts stems from differing assessments of the impact of the following factors:
1- Central bank purchases: Central banks (especially in emerging markets) continue to diversify their reserves away from the dollar and focus on gold as a key hedging asset.
2- Interest rate policies: Ongoing expectations regarding the path of interest rates and monetary policy easing are putting downward pressure on real bond yields, thereby increasing the investment appeal of gold, which does not generate a direct return.
3- Institutional Flows and Exchange-Traded Funds (ETFs): Western retail and institutional investors are once again injecting massive amounts of liquidity into index funds backed by physical gold.
4- Geopolitical and Economic Risks: Global uncertainty and rising sovereign debt are driving investors to increase their gold holdings as a safe haven.
Gold from a Technical Perspective
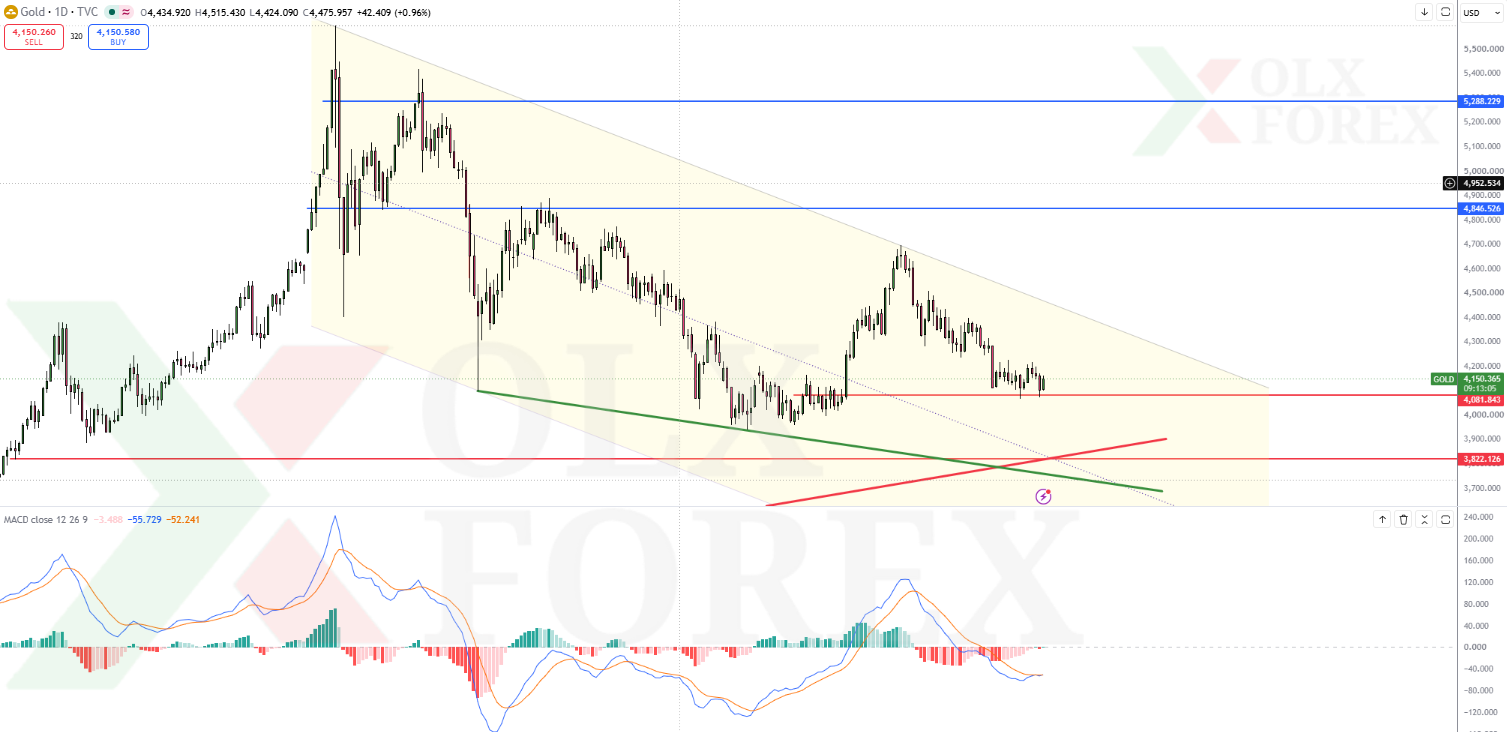
Gold prices are trading within a downward price channel on the daily chart near the $4,150 per ounce level.
As long as gold prices remain above $4,000 and then $3,800, we expect the precious metal to rise again following any corrective pullback and close the year near $4,500.
Sources
https://www.gold.org/goldhub/research/gold-demand-trends/gold-demand-trends-q1-2026
https://www.gold.org/goldhub/research/gold-mid-year-outlook-2026
https://www.kitco.com/news/article/2026-10-14/can-gold-hold-4000-october-rate-hike-still-play
https://www.markets.com/news/gold-price-today-october-15-2026
https://beincrypto.com/bank-of-america-gold-price-target-end-of-2026/


