What are Harmonic Patterns?
Harmonic patterns are a concept based on price patterns that form in financial markets according to Fibonacci ratios. Harmonic analysis focuses on identifying these patterns to predict future price movements. Financial markets tend to follow recurring patterns and move in a predictable manner using Fibonacci retracement levels.
Important Harmonic Patterns:
1. *Gartley Pattern*:
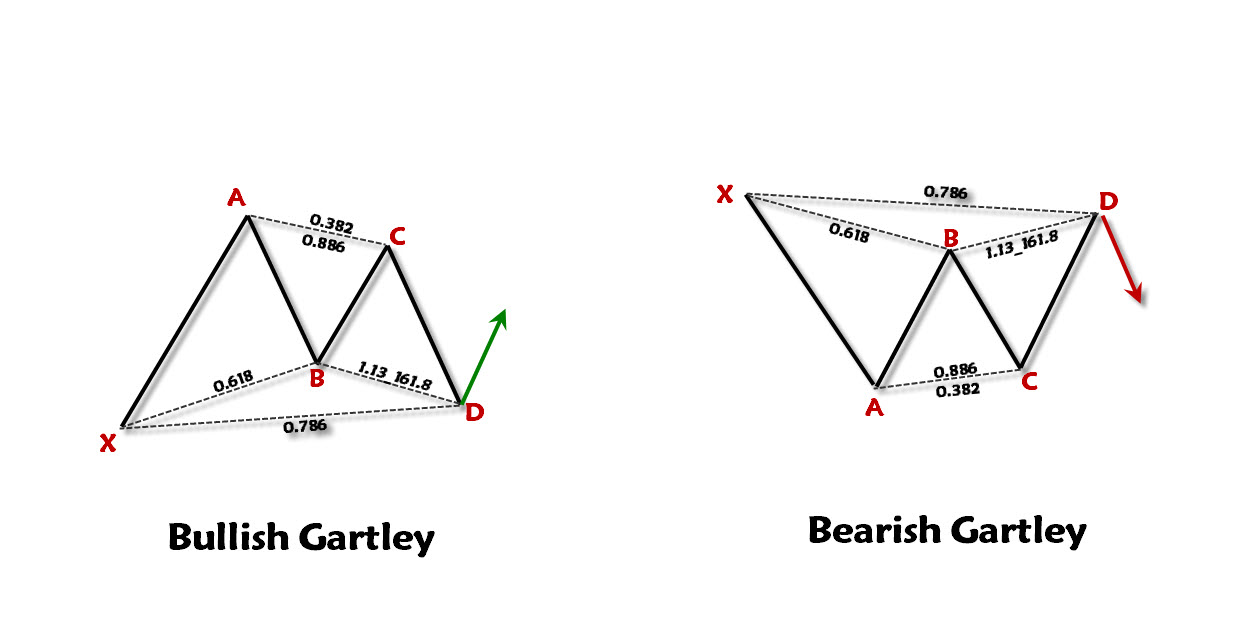
The Gartley pattern is one of the most famous and oldest harmonic patterns. It is a reversal pattern that relies on specific points formed according to Fibonacci ratios, represented by five points: X, A, B, C, and D.
- Point B represents a retracement of 0.618 of the XA leg.
- Point C is a correction between 0.382 and 0.886 of the AB leg.
- The potential reversal area at point D is derived from two paths:
- A correction between 1.13 and 1.618 of the BC leg.
- A retracement of 0.786 of the XA leg.
2- Bat Pattern:
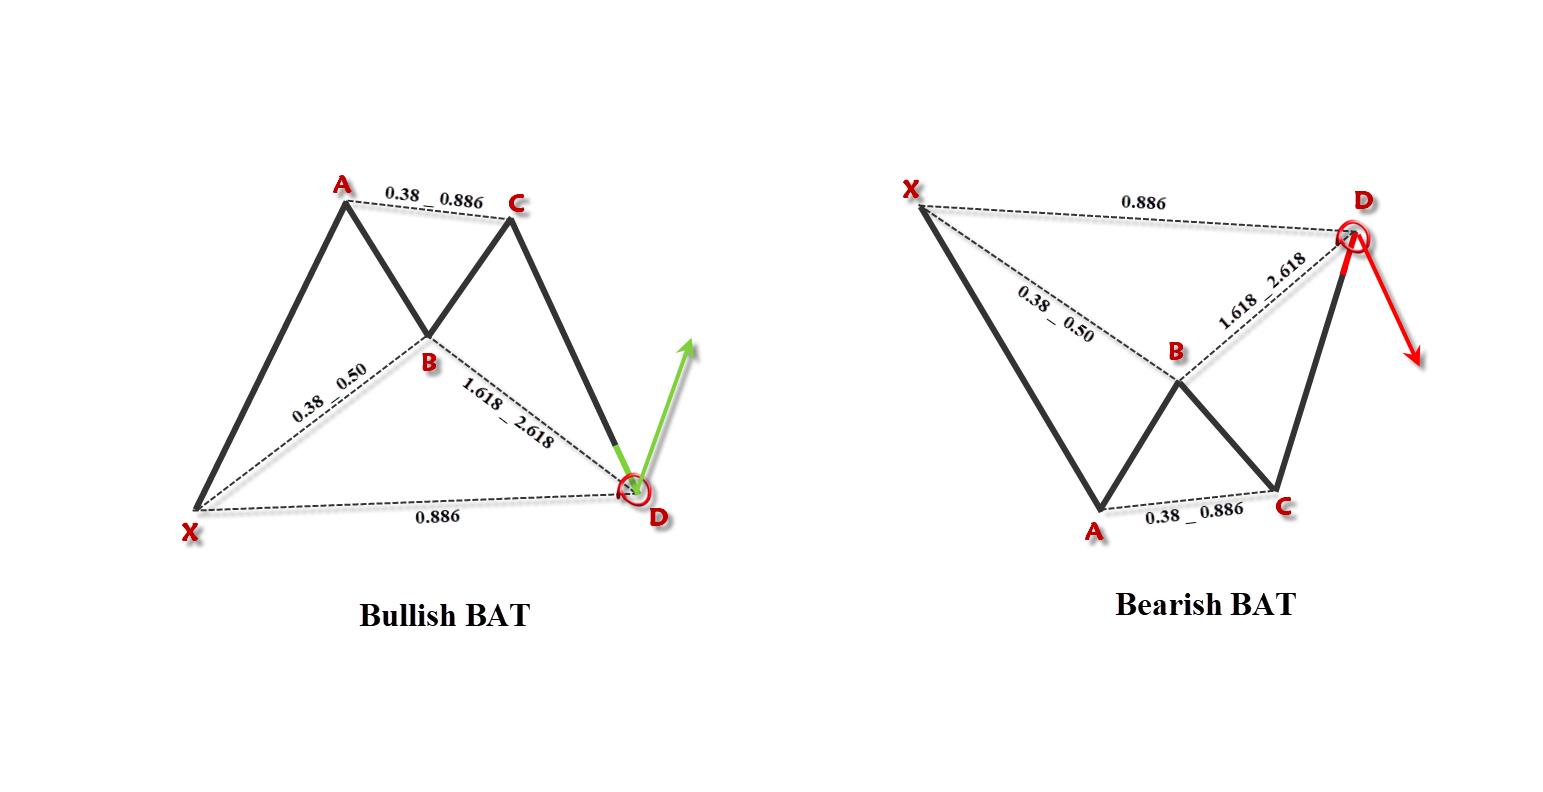
The Bat pattern resembles the shape of a bat and indicates a trend reversal, but it relies on different Fibonacci ratios.
Point B represents a retracement of 0.382 to 0.50 of the XA leg.
Point C is a correction between 0.382 and 0.886 of the AB leg.
The potential reversal area at point D is derived from two paths:
A correction between 1.618 and 2.618 of the BC leg.
A retracement of 0.886 of the XA leg.
3- Butterfly Pattern
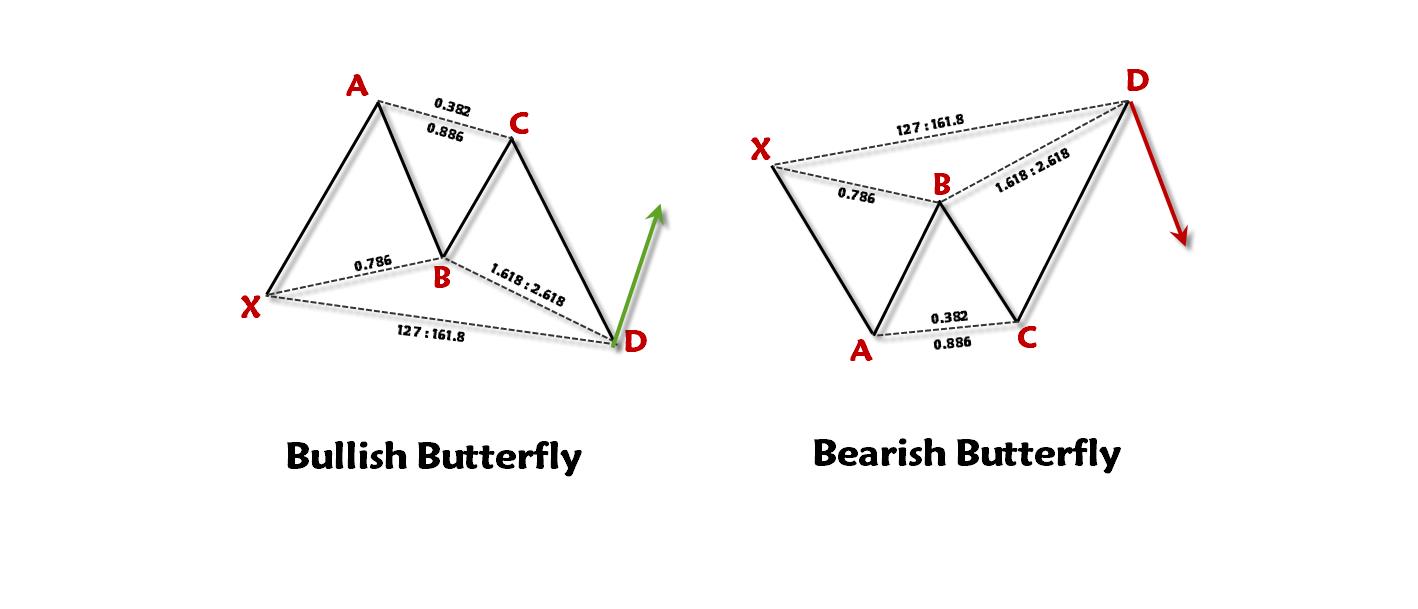
The Butterfly pattern resembles the shape of a butterfly and indicates a continuation of the trend. It consists of four price movements with key reversal points based on Fibonacci ratios.
A distinctive feature of this pattern is that point D exceeds point X.
Point B represents a retracement of 0.786 of the XA leg.
Point C is a correction between 0.382 and 0.886 of the AB leg.
The potential reversal area at Point D is derived from two paths:
A correction between 1.618 and 2.618 of the BC leg.
A correction between 1.27 and 1.618 of the BC leg.
4- Crab Pattern
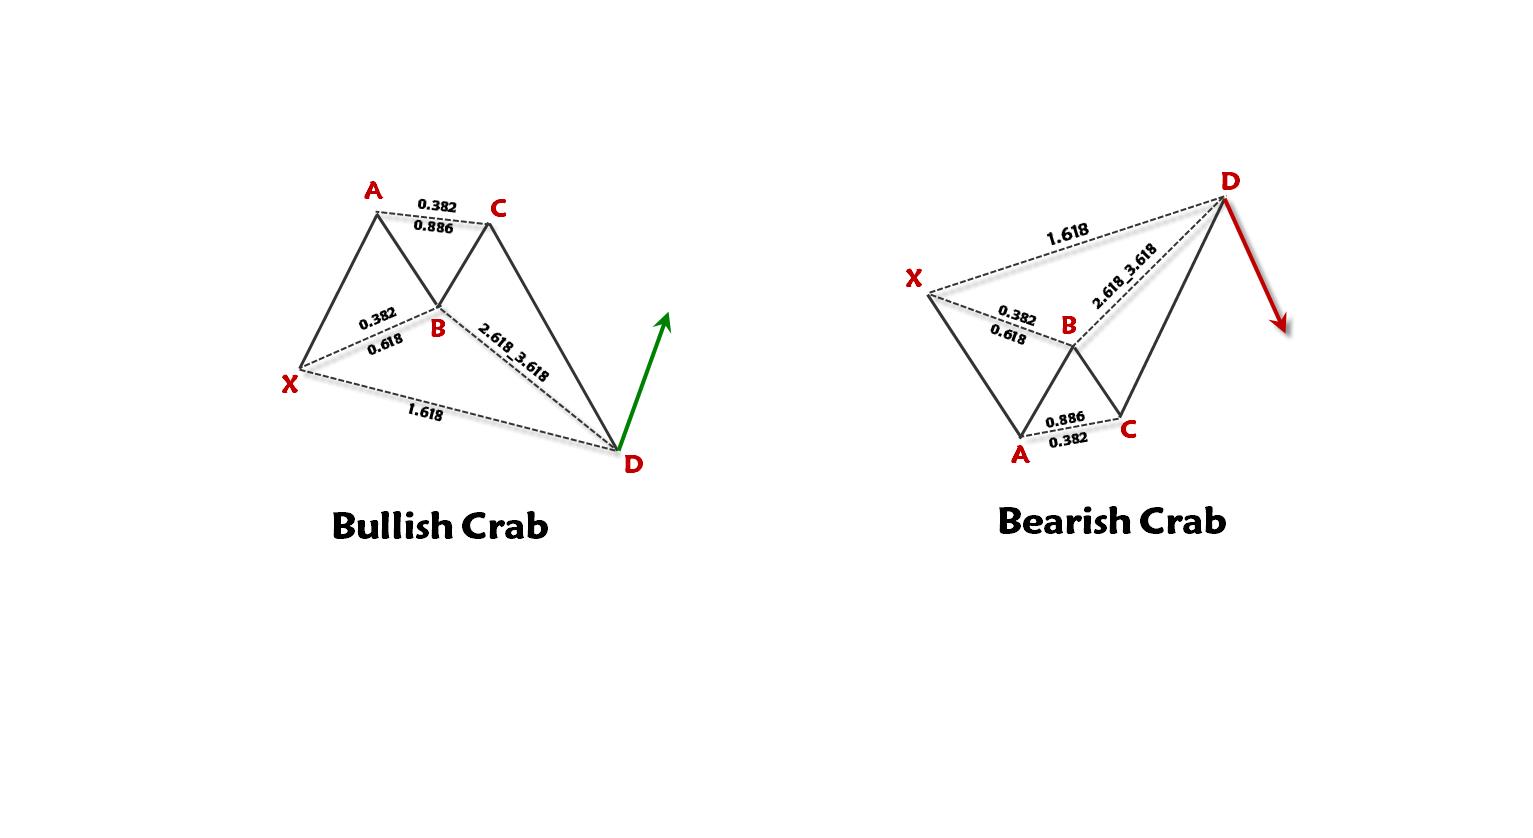
The Crab pattern resembles the shape of a crab and indicates a strong reversal in trend. It is characterized by a long CD leg and is considered one of the strongest harmonic patterns.
- *Point B* represents a retracement of 0.382 to 0.618 of the XA leg.
- *Point C* is a correction between 0.382 and 0.886 of the AB leg.
- The potential reversal area at *Point D* is derived from two paths:
- A correction between 2.618 and 3.618 of the BC leg.
- A retracement of 1.618 of the XA leg.
5- Shark Pattern
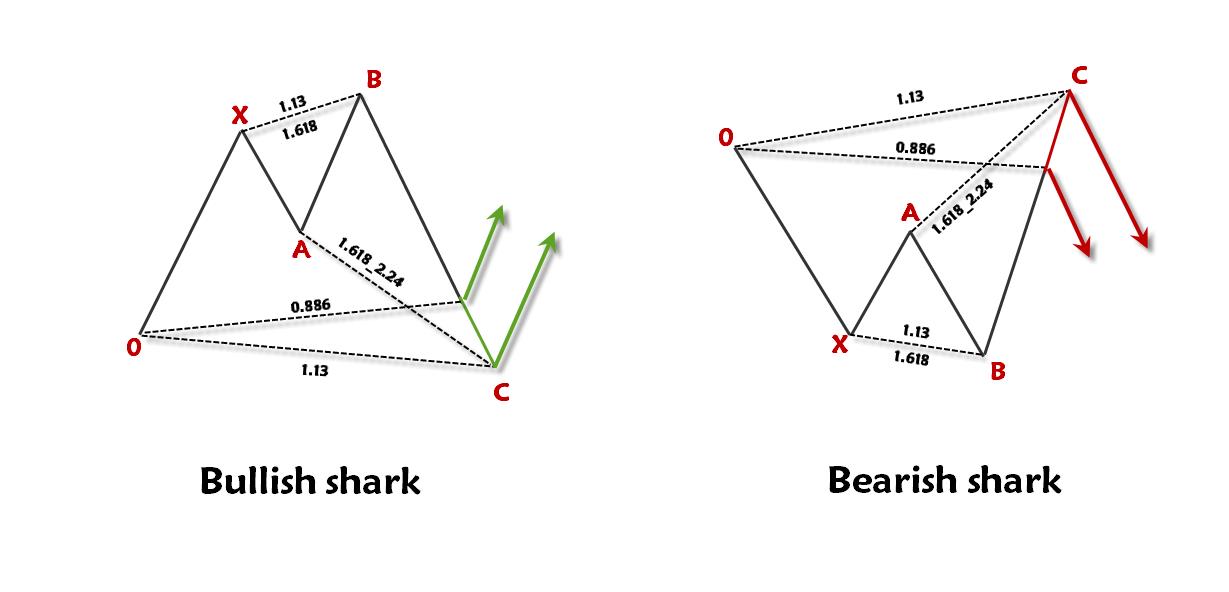
The Shark pattern utilizes unconventional Fibonacci ratios. In a buying scenario, point C is lower than A, while in a selling scenario, it is higher than A, contrasting with previous patterns. It consists of five main points: 0, X, A, B, C.
- The most important ratios in this pattern are 88.6% and 113%, which determine whether the pattern is a standard Shark or an Extended Shark.
How to Use Harmonic Patterns
- Harmonic patterns are used to identify potential reversal zones (PRZ) in the market.
- The idea behind these patterns is to pinpoint where price is expected to reverse after completing the pattern.
- Fibonacci ratios are employed to determine price targets and stop-loss levels, necessitating accuracy in identifying points and ratios.
- Harmonic patterns do not form continuously, so patience is required for their development.

