The Butterfly Harmonic Pattern: A Complete Guide to Trading Using the Crab Pattern
The Butterfly Pattern is one of the most important harmonic patterns in technical analysis and is used to identify trend reversal points with high accuracy.
The pattern takes the shape of a butterfly and consists of four main price movements (XA – AB – BC – CD), relying primarily on Fibonacci ratios.
This pattern is classified as a strong reversal pattern, helping traders enter trades at new highs or lows.
Components of the Butterfly Pattern
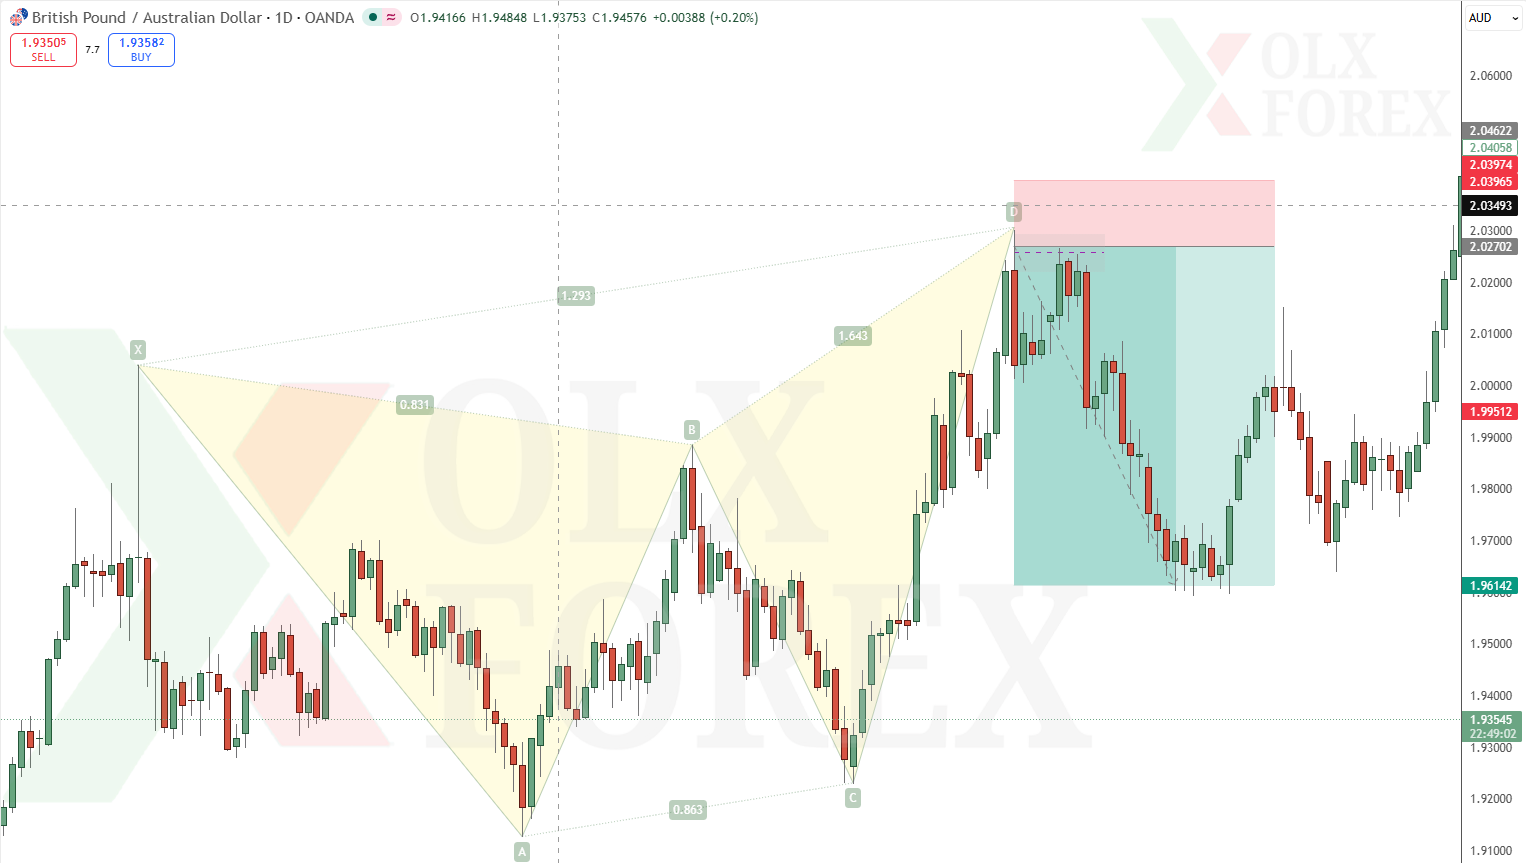
The pattern consists of five main points (X, A, B, C, D) that is, 4 main waves that form the pattern’s structure. When the pattern is complete and reaches point D , this point becomes the potential reversal zone (Potential Reversal Zone) BRZ, where the trader looks for an opportunity to enter the trade.
- Segment XA: The primary movement upon which the pattern is built
- Segment AB: A correction from segment XA
- Segment BC: A correction from segment AB
- Leg CD: The final leg representing the reversal zone
Key Characteristics of the Butterfly Pattern
Point D extends beyond Point X, which distinguishes it from other patterns such as the Gartley pattern, for example.
It relies strictly on Fibonacci ratios.
It is used to identify the end of the current trend and the start of a new reversal.
Conditions for the Butterfly Pattern to Form
Precise Ratios To ensure the validity of the pattern, the following ratios must be adhered to:
1- Segment AB
A retracement of 78.6% to 88.6% of segment XA is a prerequisite
2- Leg BC
Ranges from 38.2% to 88.6% of leg AB
3- Leg CD
which is the most important
Represents the potential reversal zone (PRZ) and is determined by:
- An extension of 1.618 to 2.618 of segment BC
- An extension of 1.27 to 1.618 of segment XA
Basic Rules of the Pattern
- Segment AB must not exceed point X
- Side BC must not exceed point A
- Side CD must exceed point X
How do you use the Butterfly Pattern in trading?
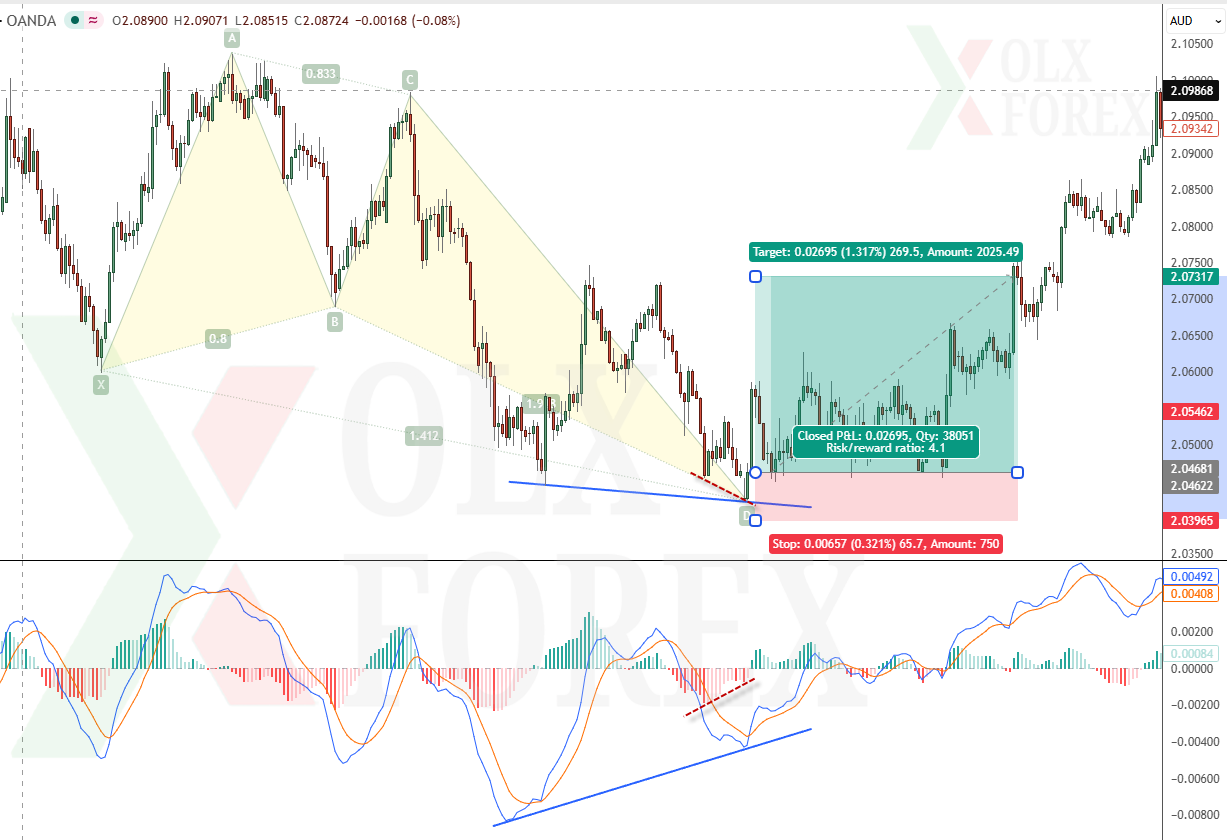
Trading using this pattern relies on entering at point D, where:
- A selling opportunity in the case of a bearish pattern
- A buying opportunity in the case of a bullish pattern
The entry is confirmed after looking for a confirmation signal using additional tools such as:
- Reversal candles
- Divergence
- Overbought or oversold conditions
- Strong support or resistance lines or trends
- Supply and demand zones
- Liquidity zones or order blocks
- Technical indicators (RSI / MACD)
Some tips for successful application of the pattern
- Do not rely on the pattern alone; wait for confirmation signals.
- Precision is the decisive factor when using the butterfly pattern.
- Correctly identifying point B is key, as it is the foundation upon which the rest of the ratios are built.
- Point D is also considered the golden opportunity to enter, so do not rush and wait for the pattern to fully complete.
- Do not treat point D as a fixed point, but rather as a potential reversal zone (PRZ).
- The more ratios that align in the same area, the better.
- Place your stop-loss slightly outside of point D.
- Do not risk more than 1-2% of your capital per trade.
Ultimately, the Butterfly pattern is one of the most powerful harmonic patterns, offering traders the opportunity to enter at very precise reversal points. However, its success depends on strict adherence to the ratios, patience until the pattern is complete, and finally, combining it with other analytical tools.