Symmetrical Triangle
The symmetrical triangle pattern is one of the most important technical analysis tools that helps traders understand price movements and make informed investment decisions.
What is the symmetrical triangle pattern in technical analysis?
The symmetrical triangle pattern represents a temporary balance between supply and demand forces, forming when:
- Lower highs are formed, indicating weak buying power
- Higher lows are formed, reflecting a decline in selling power
- The trend lines converge until they meet at a point called the apex
This neutral pattern does not determine the market direction in advance; rather, traders wait for one of the sides to break to confirm the upcoming direction.
How the pattern works in financial markets
The symmetrical triangle pattern usually appears after:
- A strong trend (upward or downward)
- The market entering a consolidation or distribution phase
- A gradual decline in trading volume
- A sharp breakout accompanied by strong momentum
Professional trading guide for the symmetrical triangle pattern
How to accurately draw the pattern
To draw the symmetrical triangle pattern correctly, follow these steps:
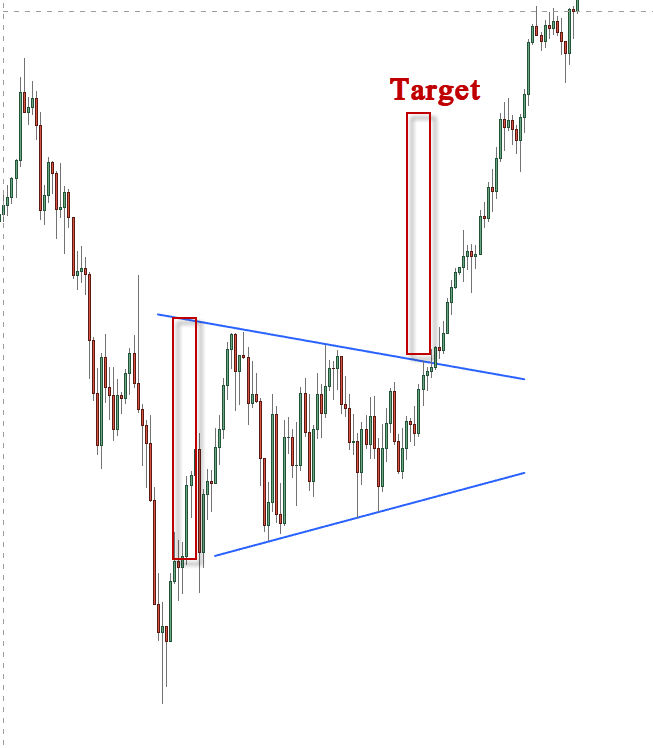
1- Draw a resistance line connecting the descending peaks.
2- Draw a support line connecting the ascending bottoms.
3- Make sure that the price touches each line at least twice to confirm the validity of the pattern.
4- Wait for a clear breakout outside the triangle with high trading volume.
Entry and exit strategies
in the event of an upward breakout:
- Entry signal: Clear candle close above the resistance line.
- Trade type: Buy
- Target: Measure the length of the triangle base and project it from the breakout point
- Stop loss: Below the last low inside the triangle
In the case of a downward breakout:
- Entry signal: Candle close below the support line
- Trade type: Sell
- Target: Length of the triangle base subtracted from the breakout point
- Stop loss: Above the last peak inside the triangle
Common mistakes to avoid
- Entering before the pattern is complete
- Trading inside the triangle instead of waiting for the breakout
- Neglecting to place stop loss orders
Ultimately, the symmetrical triangle pattern is a powerful technical pattern that usually precedes significant price movements.
The secret to its success is patience, waiting for the real breakout, and not rushing to enter.