
The Cosmodo pattern is a strong reversal pattern that often appears:
at the end of a trend, whether upward or downward, to begin reversing price movement.
Or it may appear during deep corrections that last for an extended period.
The pattern has undergone many developments, and today we will discuss its basic concept.
We will also present some successful strategies that have proven effective in trading.
Using this pattern to achieve the highest success rate for trades within the pattern.
Explanation of the Pattern
As mentioned, the pattern appears at the end of trends, whether upward or downward.
If the trend is downward, as we know, a trend consists of a series of upward waves
and downward waves, which ultimately form the downward trend.
Buying Pattern
As we see in the example, prices fall in downward waves until the price breaks below the previous low at level 3, forming low 5. Then, we see that prices
rise strongly to surpass the high shown at level 4 and close strongly above it.
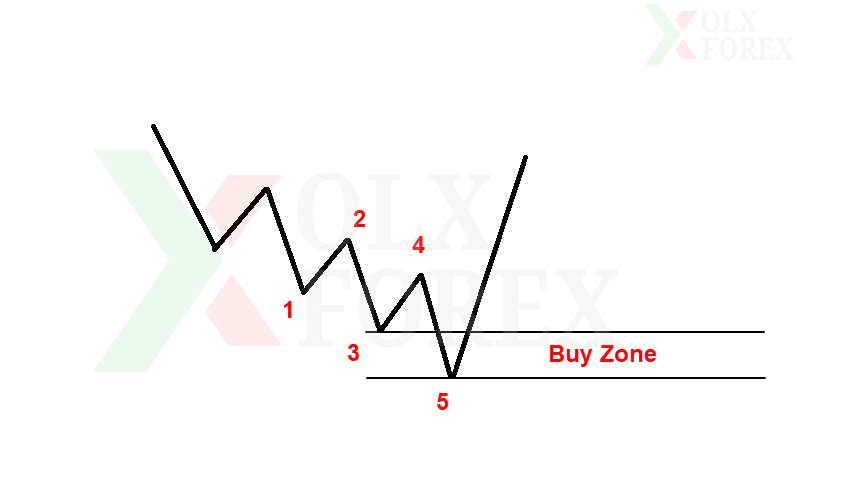
If prices hold above high 4, our pattern is complete, and buying zones are formed.
Buying zones are usually support zones between low 3 and low 5.
This entire area is considered a buy zone where trading is possible.
Selling Pattern
As we see in the image, prices are moving in an upward trend.
This is done through upward and downward waves, forming an upward price movement.
During this movement, we find that prices rose above peak number 3 to form a new peak,
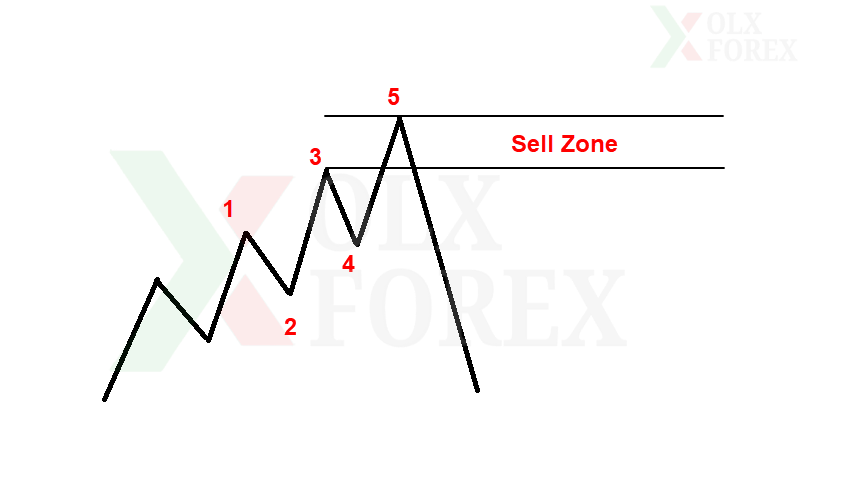
marked by the number 5. Then, prices fell sharply, breaking below trough number 4 and closing below it.
In this case, after closing and stabilizing below the last trough, the bearish Cosmodo pattern is formed.
This pattern is located at the previous peaks, number 3 and number 5.

Developments and New Additions
In our previous explanation, we discussed the original pattern and how it was extracted and worked on.
Of course, extracting the pattern in isolation and working on it directly has become highly risky.
Because you are essentially trading against the current trend, the risk is significant. Therefore, analysts have tried to
develop the pattern to generate better opportunities with a high success rate.
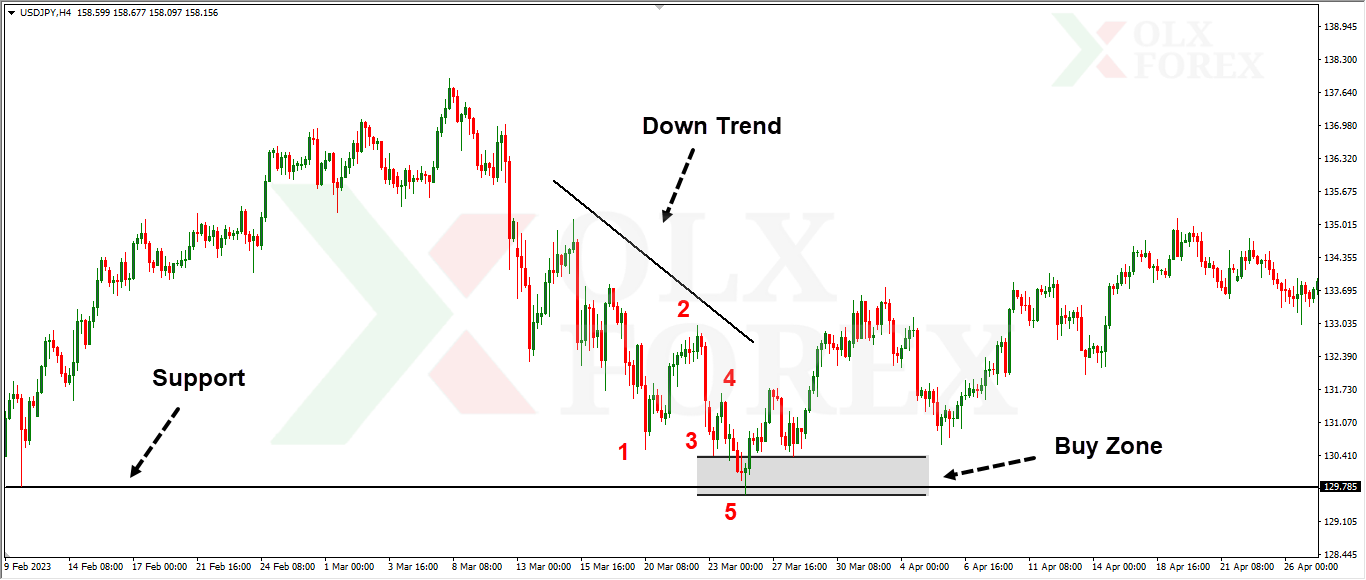
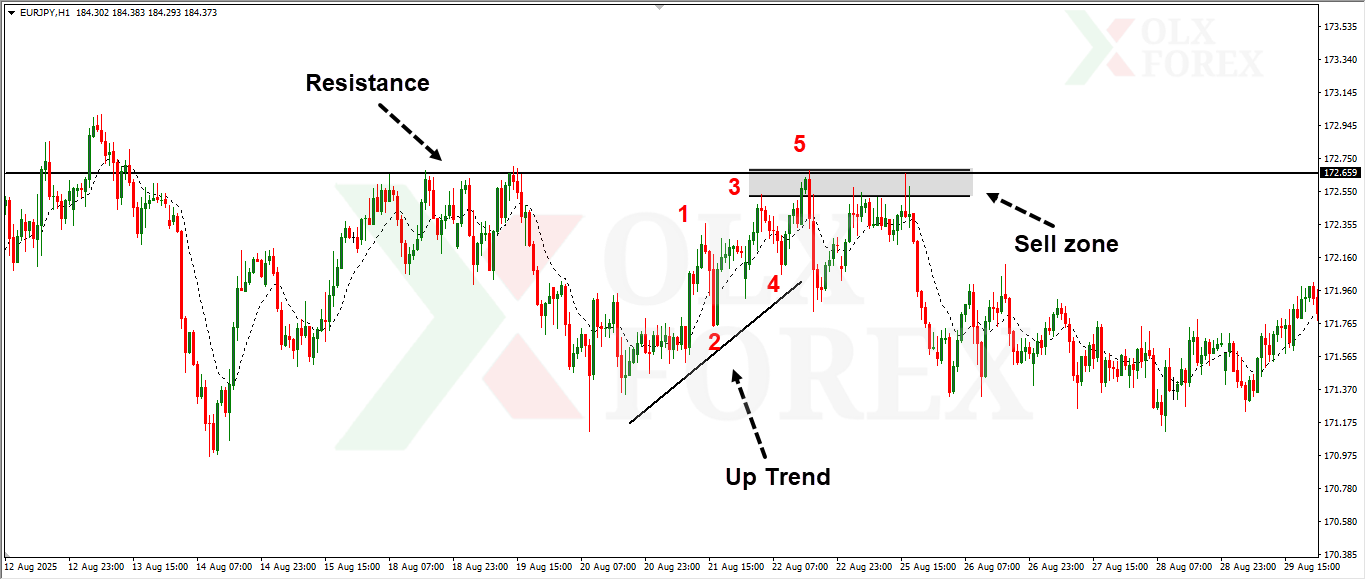
Support and Resistance
Support and resistance levels are essential elements for extracting the pattern.
The pattern should form at support or resistance levels, whether on the same timeframe or a higher one.
The higher the timeframe used for support and resistance, the better.
This is because it provides a higher success rate due to the presence of genuine buy or sell orders at the pattern.
Japanese Candlesticks
These are important and powerful technical tools that are relied upon when the price returns
to the entry levels that were formed, which we discussed when explaining the bearish and bullish patterns.
When reversal patterns appear, such as engulfing candles or pin bar candles, this gives
a very high success rate at the entry levels and makes the pattern highly successful.
Supply and Demand
Another very important and powerful technical tool is the formation of supply and demand zones at the same
entry levels of the pattern. Here, the pattern is considered very strong, and its success rate is
extremely high, and the opportunities extracted are among the best available.
Of course, the availability of supply and demand within the same entry points for the pattern is limited.
However, when multiple opportunities arise, these entry points become a very powerful tool for filtering them out.
And selecting the best available entry point.
Targets and Stop Losses
Regarding setting targets and stop losses, several methods have emerged with the development of the market.
But one of the best methods is as follows:
To set the stop loss for a sell position, place it above the last high (number 5)
by a few points, between 5 and 10 pips, taking into account the spread.
For a sell position, place it below the last low (number 5), between 5 and 10 pips only.
To set targets for a sell position, take the previous lows (numbers 2 and 4).
Alternatively, you can set two targets: the first target equals the number of stop loss points,
and the second target is double the number of stop loss points.
To determine buy targets, use the previous peaks numbered 2 and 4.
Alternatively, you can set two targets: the first target equals the number of stop-loss points,
and the second target is double the number of stop-loss points


